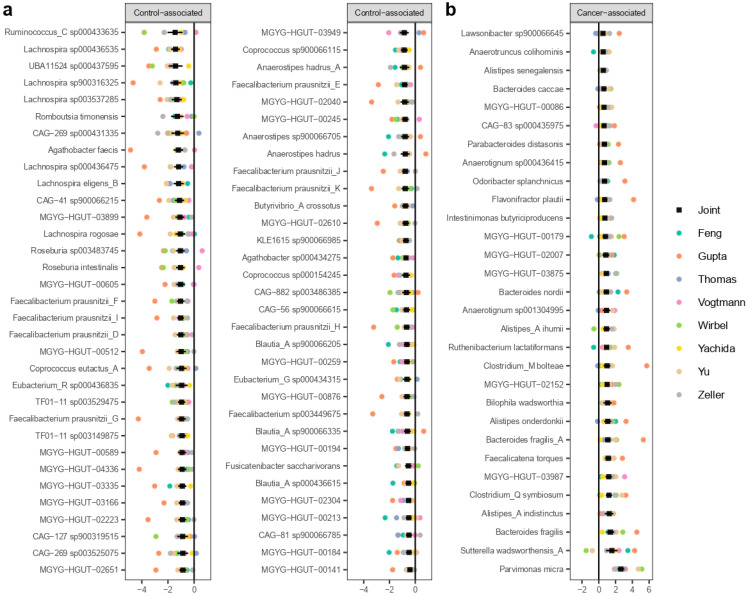
Figure 2.
Species that were statistically associated to CRC. Black squares with lines represents the estimate of the effect size and 95% confidence intervals. The colored dots represent the estimates of the effect sizes for each dataset. (a) Species that were found to be decreased in cancer (columns 1 and 2). (b) Species that were found to be increased in cancer (column 3).

