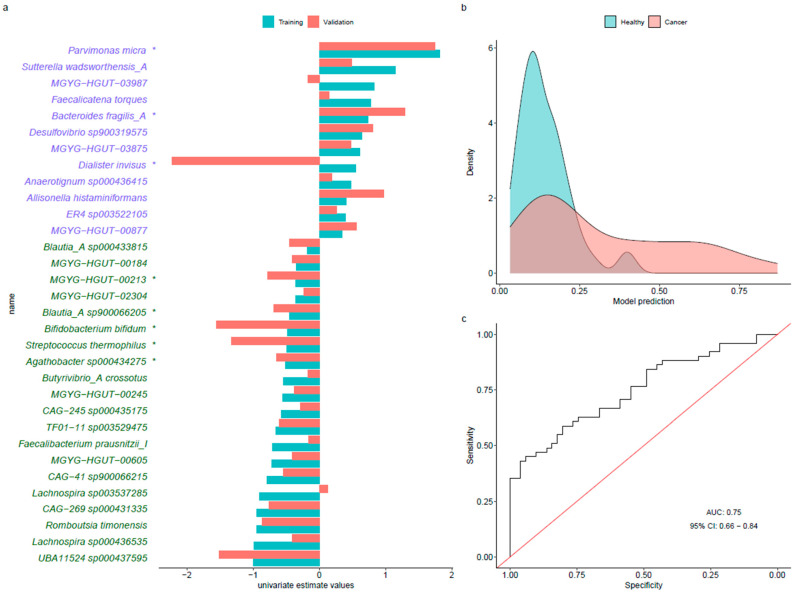
Figure 3.
Summary of the LASSO predictive model in our dataset. (a) Training (blue) and validation (red) estimate values for each control-enriched (green) and cancer-enriched (purple) species selected by the model. (b) Density plot of model prediction, colored by the status of the samples. (c) Receiver operating characteristic curve representing the performance of the model. *: statistically significant (p-value < 0.05) based on Wilcoxon rank sum test in aldex.ttest.

