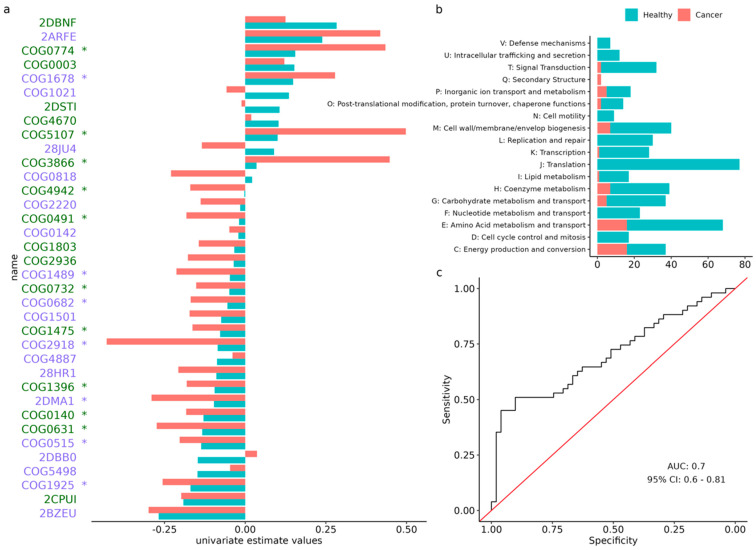
Figure 4.
Analysis of eggNOG orthologous group. (a) Training (blue) and validation (red) estimate values for each control-enriched (green) and cancer-enriched (purple) species that was selected by the model. (b) Amount of significantly associated orthologous groups, clustered by general category. Blue represents the control-associated groups, while red represents the cancer-associated groups. Category “S” (function unknown) was excluded. Orthologous groups belonging to more than one category were counted for each. (c) The receiver operating characteristic curve representing the performance of the predictive model. *: statistically significant (p-value < 0.05) based on Wilcoxon rank sum test in aldex.ttest.

