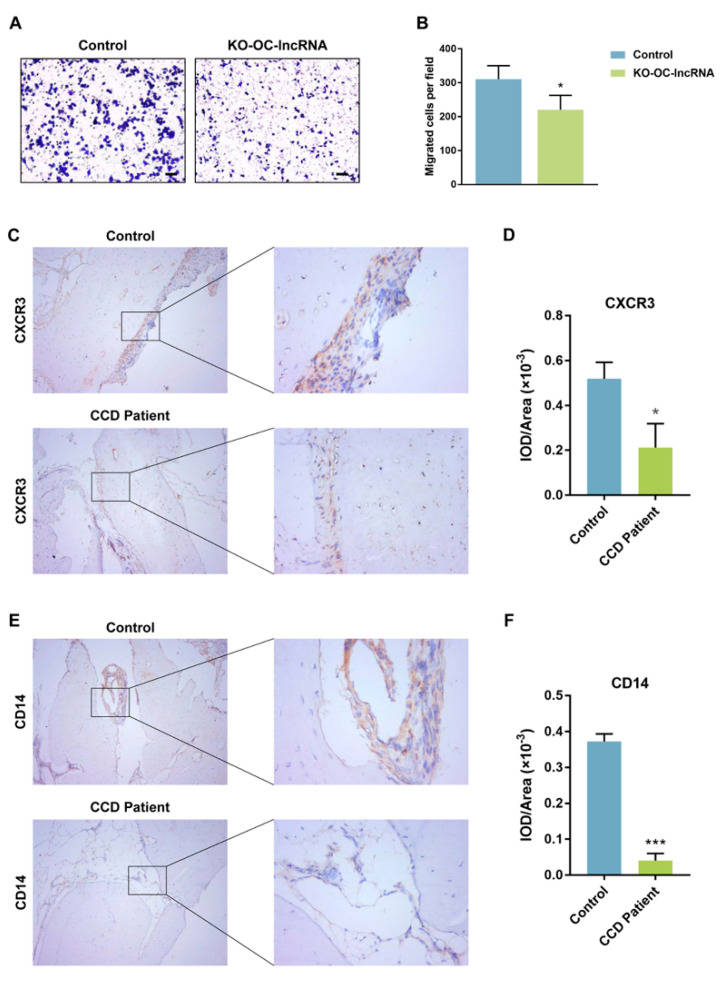
Figure 6.
Monocytes chemotaxis detected by and immunohistochemistry. (A) Representative images of transwell migration assay. Scale bar, 500 μm. (B) Quantitative analysis of transwell migration. (C) Immunohistochemistry for CXCR3 in alveolar bone (Left panel, ×100; Right panel, ×400). (D) Quantification of CXCR3 protein expression. (E) Immunohistochemistry for CD14 in alveolar bone (Left panel, ×100; Right panel, ×400). (F) Quantification of CD14 protein expression. Error bars represent SD. * p < 0.05, *** p < 0.001.

