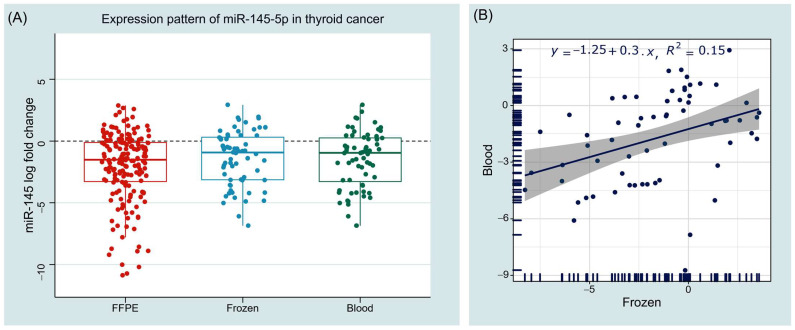
Figure 5.
Expression pattern of miR-145 in human tissue and blood samples. (A) Boxplots show the log of relative expression levels in cancer samples compared with controls. Wilcoxon matched-pairs signed rank and Mann–Whitney U tests were used. (B) Correlation analysis between tissue and blood samples. Spearman’s correlation test was utilized. FFPE: formalin fixed paraffin embedded tissue sections; Frozen: fresh frozen tissues.

