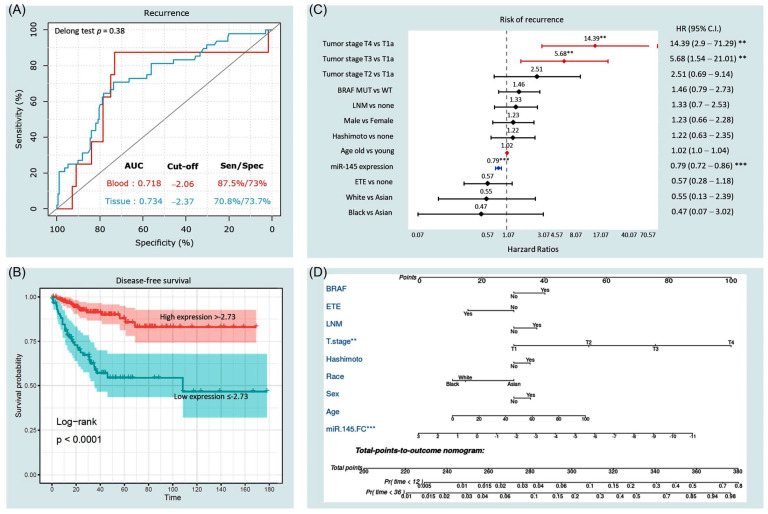
Figure 7.
Prognostic value of miR-145 expression. (A) Receiver operator characteristic analysis for the role of miR-145-5p in tissues and blood. Area under the curve (AUC) is reported. Sen: sensitivity; spec: specificity. (B) Kaplan–Meier survival curve analysis for disease-free survival. Log fold changes in miR-145 in tissues were split into high and low expression groups based on the optimum cutoff value of ROC analysis. Log-rank test was used. (C) Predictor risk factors for disease-free survival. Multivariate Cox proportionate hazard regression model was employed. The results are presented as hazard ratio and confidence interval. Red lines have a higher risk of recurrence, while blue lines represent a protective variable. ** indicates p < 0.01 and *** indicates p < 0.001. (D) Prognostic nomogram for predicting recurrence at the time of diagnosis. miR145: microRNA-145-5p expression level as log fold change; ETE: extrathyroidal extension; LNM: lymph node metastasis.

