Figure 3.
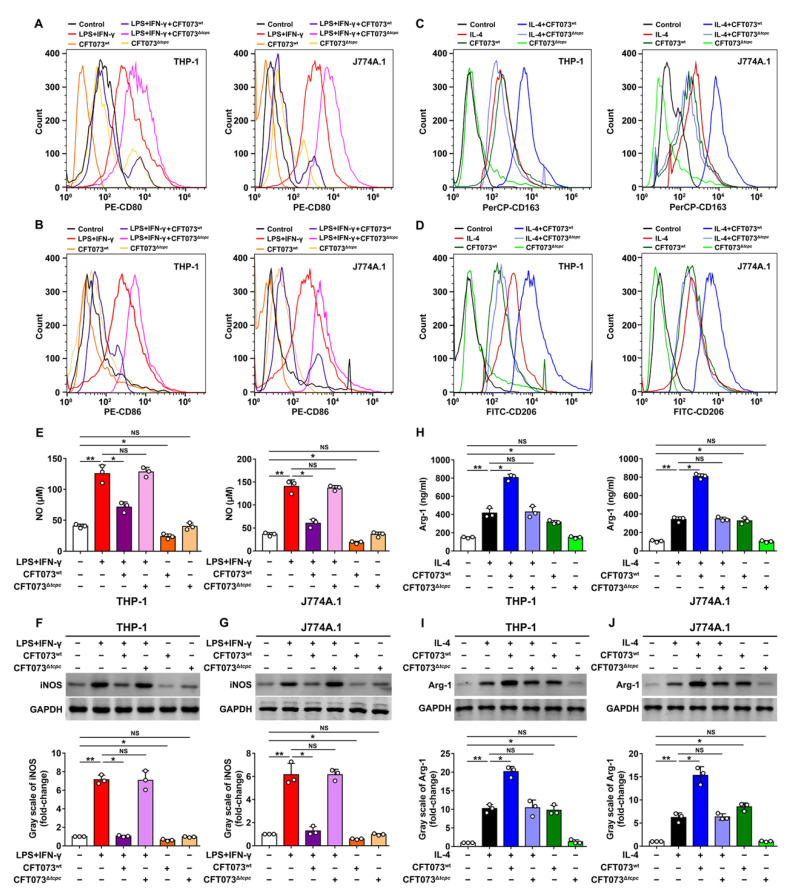
CFT073wt suppresses M1 but promotes M2 macrophage polarization in vitro. (A,B) The expression of M1 surface markers CD80 and CD86 in THP-1 and J774A.1 was detected by flow cytometry. (C,D) The expression of M2 surface markers CD163 and CD206 in THP-1 and J774A.1 was analyzed by flow cytometry. (E) The production of NO in THP-1 and J774A.1 was measured by Griess method. (F,G) The iNOS protein levels and bands’ gray-scale analyses in THP-1 and J774A.1, respectively. (H) The protein levels of Arg-1 in THP-1 and J774A.1 were detected by ELISA. (I,J) The protein levels of Arg-1 were detected by Western blot and bands’ gray-scale analyses in THP-1 and J774A.1, respectively. Gray scale in the control group was set as 1.0. Mean ± SD of three independent experiments are shown. *: p < 0.05; **: p < 0.01. NS: not significant.

