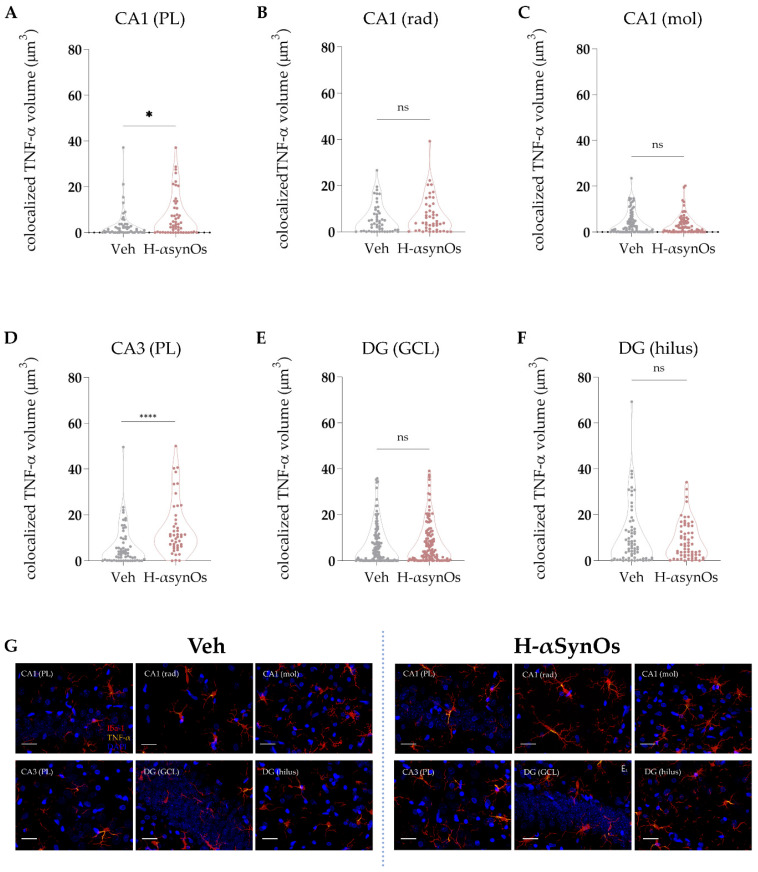
Figure 5.
Microglial TNF-α content was increased in the hippocampal CA1 and CA3 subregions following H-αSynOs infusion. (A–F) Volume of colocalized TNF-α within Iba-1+ cells in discrete subfields of the dorsal hippocampus (n(CA1-GCL) = 50−55, n = 6 animals per group; * p < 0.05 by Mann–Whitney test; n(CA3-GCL) = 60−45, n = 6 animals per group; **** p < 0.0001 by Mann–Whitney test). (G) Representative images of TNF-α (yellow) colocalized within Iba-1+ cells (red). Magnification 63×. Scale bars: 20 μm. GCL (granular cell layer); rad (radiatum); mol (molecular); DG (dentate gyrus), PL (pyramidal layer); n.s. = not significant.

