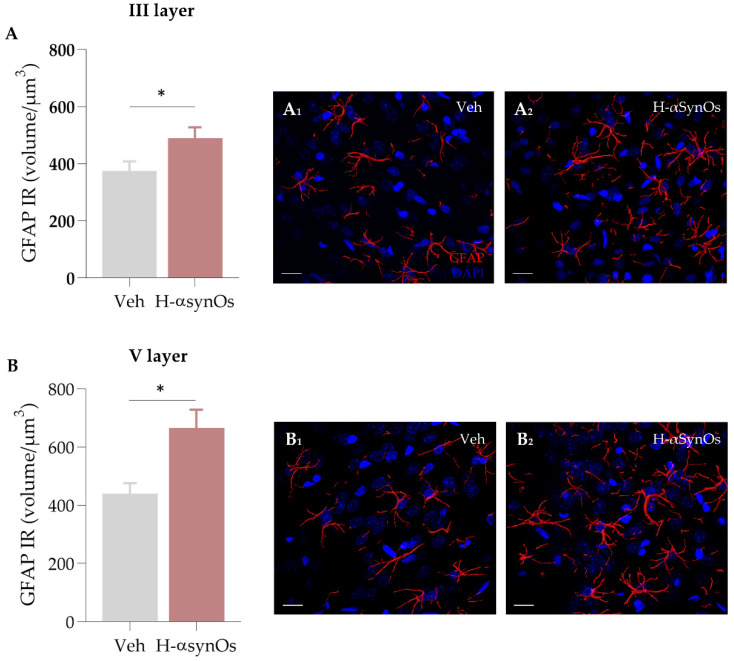
Figure 6.
GFAP immunoreactivity in the anterior cingulate cortex following after H-αSynOs infusion. Total volume occupied by GFAP+ cells in the cingulate cortical layers (A) III (n = 80–110 cells, n = 6 animals per group; * p < 0.05 by Mann–Whitney test) and (B) V (n = 90 cells, n = 6 animals per group; * p < 0.05 by Mann–Whitney test). Representative images of GFAP (red) in the (A1,A2) III and (B1,B2) V layer of ACC. Magnification 63×. Scale bar: 20 μm.

