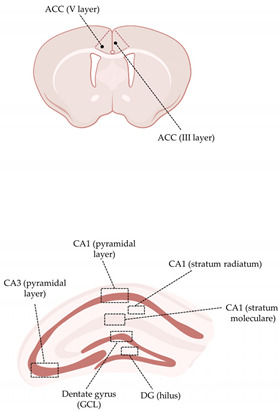
Table 1.
Iba-1+ immunoreactivity in anterior cingulate cortex and dorsal hippocampus following H-αSynOs intranigral infusion.
| ACC (Iba-1 IR; Volume/mm3) |

|
||
| Veh | H-αSynOs | ||
| III layer | 318.4 ± 23.02 | 357.1 ± 25.25 | |
| V layer | 348.6 ± 24.80 | 380.2 ± 26.42 | |
|
Dorsal Hippocampus (Iba-1 IR;
Volume/mm3) | |||
| Veh | H-αSynOs | ||
| DG (GCL) | 335.2 ± 16.68 | 348.6 ± 22.24 | |
| DG (hilus) | 320.8 ± 16.53 | 387.2 ± 20.30 * | |
| CA3 (pyramidal layer) | 280.8 ± 18.75 | 249.7 ± 16.52 | |
| CA1 (pyramidal layer) | 463.1 ± 28.13 | 600.5 ± 30.42 ** | |
| CA1 (stratum radiatum) | 564.2 ± 28.49 | 644.5 ± 39.35 | |
| CA1 (stratum moleculare) | 899.7 ± 40.77 | 843.6 ± 44.55 | |
Each reported value represents the total volume occupied by Iba-1+ cells in the selected subregions. Values represent the mean ± SEM. * p < 0.05; ** p < 0.01 by Mann–Whitney test. BioRender.com was used to compose the figure.
