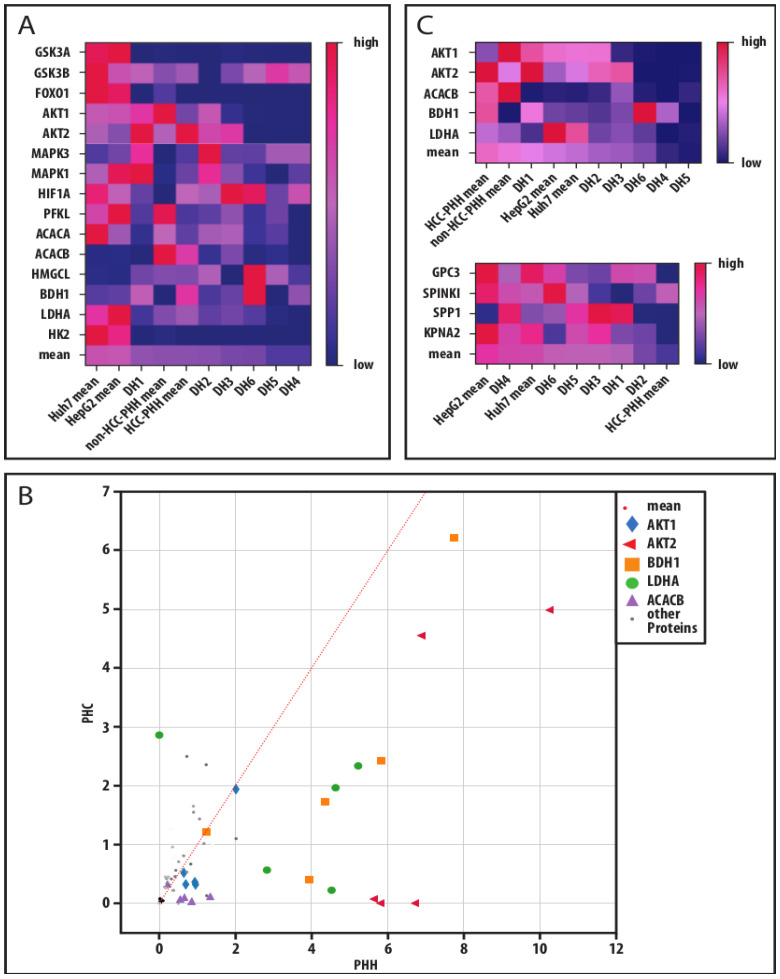
Figure 6.
Metabolic and cancerous dedifferentiation of primary human hepatoma cells. (A) Absolute protein values of measured markers were transferred to a relative percentage scale. The relative values were displayed in their respective color on a color gradient. Mean values of a donor or cell entity were calculated from all markers in a column and the columns were sorted by their respective relative mean values resulting in heat maps. This analysis was performed for all investigated metabolic protein markers to display their metabolic dedifferentiation. (B) Absolute protein values of metabolic markers measured in PHCs, and their corresponding PHHs were also plotted to display their metabolic shift through cancerous dedifferentiation and key players were identified by their distance to the identity function (slope = 1). (C) For investigation of a link between metabolic and cancerous dedifferentiation in PHCs derived from different donors compared to hepatoma cell lines and PHHs, the heat maps of the selected metabolic key players and of hepatocellular tumor markers are displayed. Abbreviations: PHH, primary human hepatocyte; HCC, hepatocellular carcinoma; DH, HCC-diagnosed patient 1–6; GSK3A, glycogen synthase kinase 3 alpha; GSK3B, glycogen synthase kinase 3 beta; FOXO1, forkhead box O1; AKT1, AKT serine/threonine kinase 1; AKT2, AKT serine/threonine kinase 2; MAPK3, mitogen-activated protein kinase 3; MAPK1, mitogen-activated protein kinase 1; HIF1A, hypoxia inducible factor 1 alpha; PFKL, phosphofructokinase liver type; ACACA, acetyl-CoA carboxylase alpha; ACACB, acetyl-CoA carboxylase beta; HMGCL, 3-hydroxymethyl-3-methylglutaryl-CoA lyase; BDH1, 3-hydroxybutyrate dehydrogenase 1; LDHA, lactate dehydrogenase A; HK2, hexokinase 2; GPC3, glypican-3; SPINK1, serine protease inhibitor Kazal type 1; SPP1, secreted phosphoprotein-1; KPNA2, karyopherin subunit alpha 2.

