Figure 3.
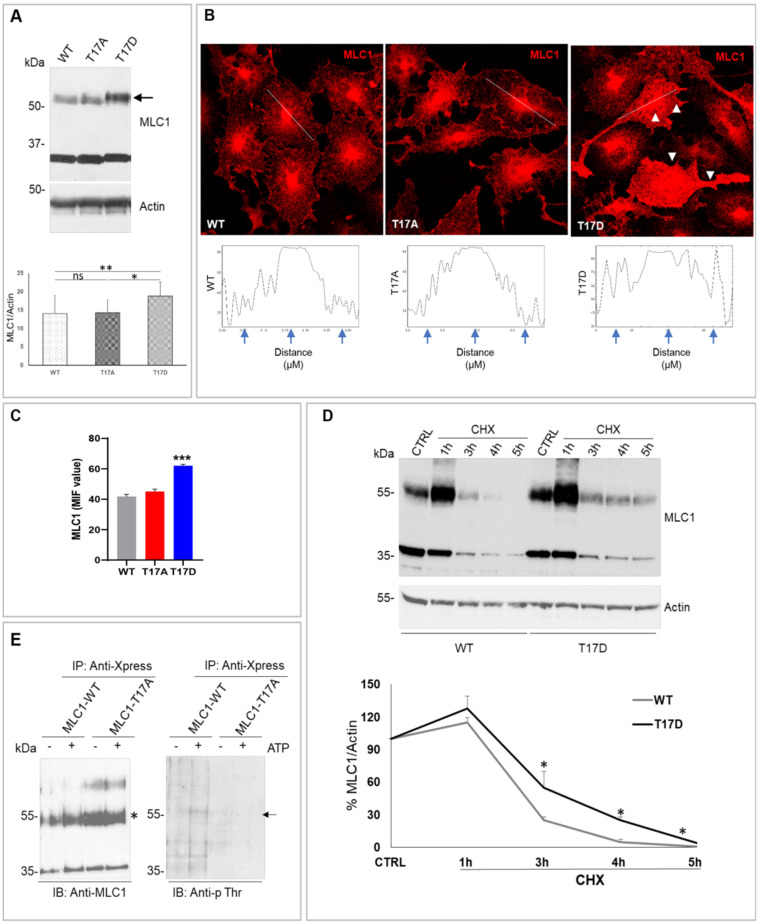
CaMKII-mediated phosphorylation of the MLC1 T17 residue favors MLC1 protein dimerization and stabilization. (A) WB analysis of U251 mutant cell lines shows that T17D substitution favors MLC1 dimer formation (arrow) when compared to MLC1-WT and T17A expressing cells. The bar graph below the WB represents the densitometry analysis of the MLC1 protein bands normalized with the amount of actin (means ± SEM of 3 independent experiments; * p < 0.05, ** p < 0.001 calculated using non-parametric test). Panel (B) shows IF staining of cells expressing MLC1-WT, T17A, and T17D mutants with anti-MLC1 pAb (red). An increase of the MLC1-T17D mutant localization at PM and in intracellular compartments (arrowheads in B) when compared to WT and T17A MLC1 is observed. Scale bars: 20 μm. Below each IF panel, the distribution of IF pixel intensity along a freely defined line (representatively indicated in each IF images) spanning the whole cell confirms a general increase of the MLC1-T17D protein fluorescence intensity. Fluorescence intensity peaks are marked by arrows. One representative intensity plot is shown for each IF panel. (C) Mean fluorescence intensity (MIF) of 50–60 cells/conditions from 3 independent experiments was calculated (means ± SEM values of mean, *** p < 0.0001 calculated using one-way ANOVA, unpaired two-tailed Student’s t-test). (D) WB analysis of U251 cells expressing MLC1-WT and the T17D mutant, untreated (CTRL) or treated with cycloheximide (CHX, 100 µg/mL) for 1, 3, 4, and 5 h revealed an increase of the MLC1-T17D protein half-life (stability) when compared to MLC1-WT. A graph indicating the densitometry analysis of MLC1 protein bands normalized with the amount of actin is shown below. Data are expressed as the percentage of the value measured in control untreated cells (means ± SEM of 3 replicates for each type of experiments; * p < 0.05 calculated using non-parametric test). (E) WB of protein eluates derived from immunoprecipitation of MLC1-WT and MLC1-T17A expressing cells with anti-Xpress mAb in control conditions or after ATP stimulation (5 min, 100 µM). Immunoblotting was performed with the anti-MLC1 pAb (asterisk), as positive control of IP procedures, and with anti-phosphothreonine (anti-p Thr) mAb to assess Thr phosphorylation levels. As indicated by the arrow, Thr phosphorylation signal increases after ATP stimulation in MLC1-WT, corresponding with the MLC1 protein molecular weight, and not in MLC1-T17A expressing cells.

