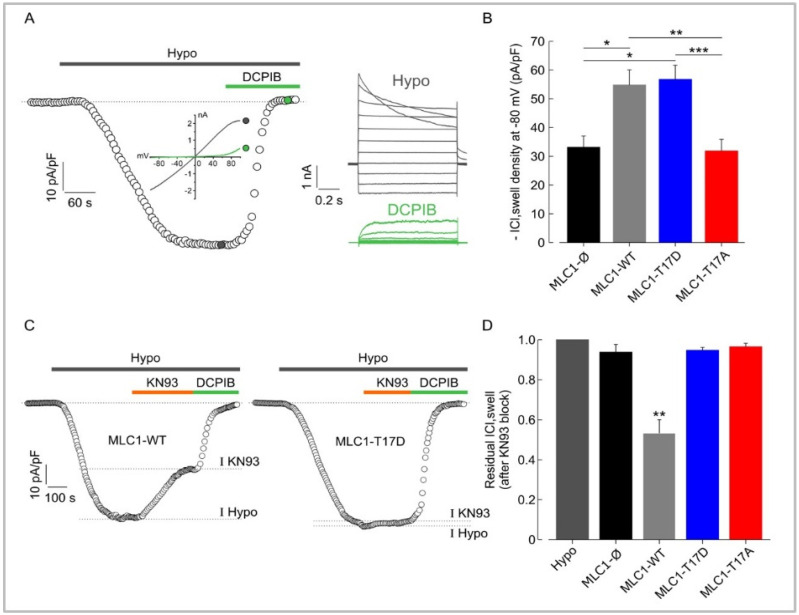
Figure 5.
Phosphorylation of MLC1-T17 potentiates ICl,swell in U251 cells. (A) Representative time course of ICl, swell density (pA/pF) measured at −80 mV (the equilibrium potential for K+ under our recording conditions), taken from current ramps (from −100 to 100 mV, 600 ms duration, holding potential −40 mV) applied during the application of hypotonic solution (grey trace) and upon addition of 10 µM DCPIB (green trace). Right: families of current traces evoked by applying 1 s voltage steps from −100 to 100 mV, in steps of 20 mV (HP −40 mV) in the presence of a hypotonic solution (grey traces), and upon addition of 10 µM DCPIB (green traces). (B) Bar plot showing the average current density measured at −80 mV during exposure to 30% hypotonic solution, in U251 cells transfected with the empty vector (MLC1-Ø, n = 10), with MLC1-WT protein (n = 14), and with MLC1-T17D (phosphorylation mimicking mutant, n = 9) or MLC1-T17A (not phosphorylatable mutant, n = 14). (C) Representative time courses of ICl,swell density (pA/pF) measured at −80 mV from current ramps, during application of hypotonic solution (grey bar) and upon addition of 10 µM KN93 and 10 µM DCPIB, in MLC1-WT (left) and MLC1-T17D (right) U251 cells. The dashed lines in the time courses indicate the levels where the peaks of currents were measured. (D) Bar plot showing the mean residual ICl,swell in the presence of 10 µM KN93, as normalized to the ICl,swell elicited during exposure to 30% of hypotonic solution in the absence of the KN93 (Hypo), in the different cell lines (Mean ± SEM n = 3–5; * p < 0.05; ** p < 0.01, *** p < 0.001).

