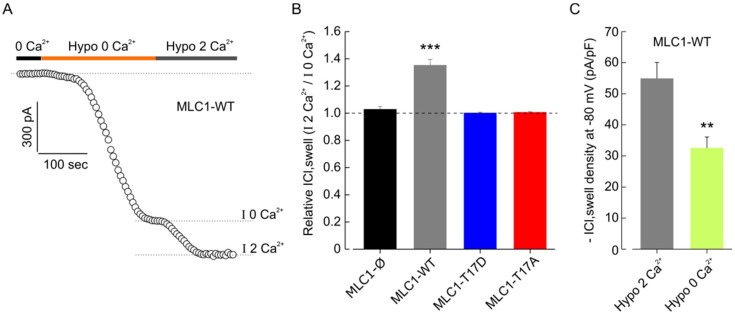
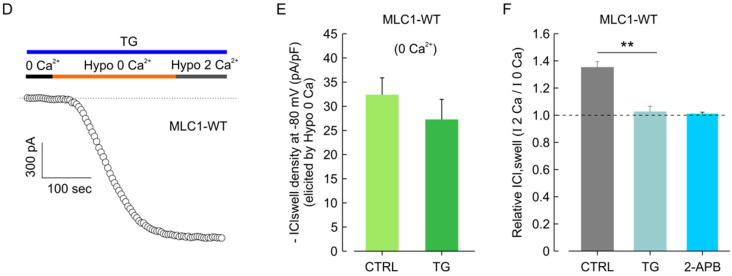
Figure 7.
Extracellular and endoplasmic reticulum Ca2+-dependence of ICl,swell in U251 cell lines carrying WT and mutated MLC1. (A) Representative time course of ICl,swell during application of a Ca2+-free hypotonic solution (Hypo 0 Ca2+) and a hypotonic solution containing 2 mM Ca2+ (Hypo 2 Ca2+). The dashed lines indicate the levels where the maximal hypotonic-activated current in the absence (I 0 Ca2+) and presence (I 2 Ca2+) of extracellular Ca2+ were measured. (B) Bar plot showing the mean ICl,swell current elicited by the addition of 2 mM external Ca2+ (dashed lines), normalized to the current activated by Hypo 0 Ca2+, in MLC1-Ø (n = 5), MLC1-WT (n = 8), MLC1-T17D (n = 6), and MLC1-T17A (n = 5) U251 cell lines (mean ± SEM, *** p < 0.01, using one-sample t-test). (C) Bar plot showing the average current density during exposure to hypotonic solution, in the continuous presence (grey bar, n = 14) or absence (light green bar, n = 9) of external Ca2+, assessed in MLC1-WT cells (mean ± SEM, ** p < 0.01, using two-sample t-test). (D) Representative time course of ICl,swell during application of a Ca2+-free hypotonic solution (Hypo 0 Ca2+) followed by a hypotonic solution containing 2 mM Ca2+ (Hypo 2 Ca2+), after 1 μM of thapsigargin (TG) pretreatment (5 min to deplete ER Ca2+stores). (E) Bar plot showing the average current density during exposure to hypotonic 0 Ca2+ solution, in MLC1-WT cells in the absence (CTRL, n = 9) and presence (TG, n = 9) of TG pre-treatment (mean ± SEM, p = 0.36). (F) Bar plot showing the mean fractional ICl,swell elicited by Hypo 2 Ca2+, normalized to the current activated by Hypo 0 Ca2+, in MLC1-WT cells either in the absence (n = 14) or presence (n = 9) of TG or of the IP3R inhibitor 2-APB (n = 7) (mean± SEM, ** p < 0.01).


