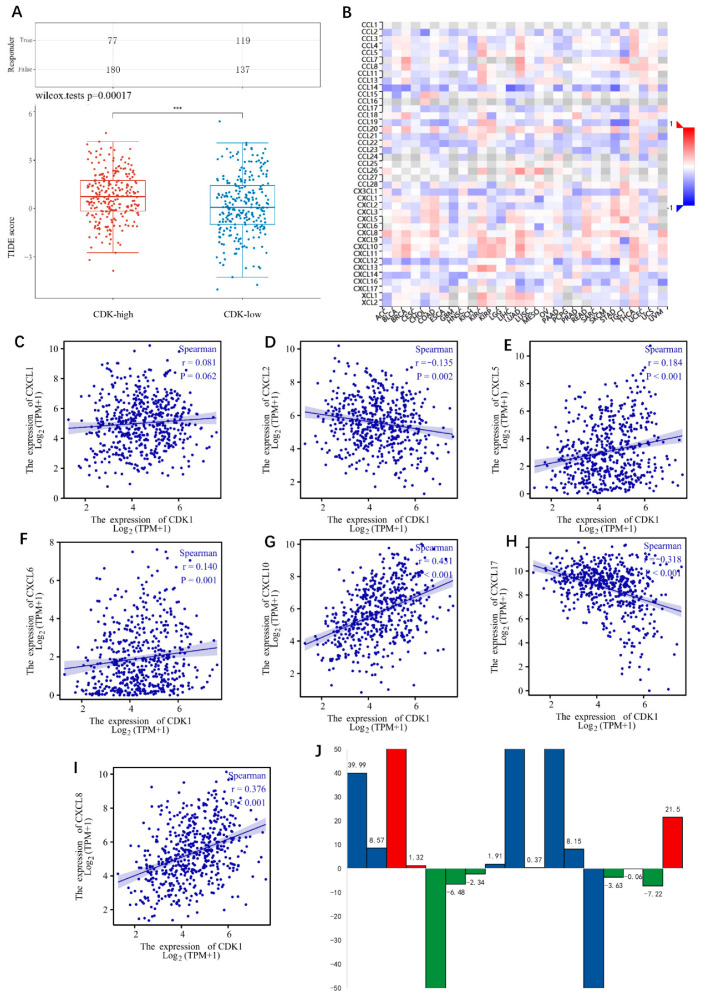
Figure 4.
(A) The correlation between the expression of CDK1 and the response of immune checkpoint inhibitors. *** p < 0.001. (B) The correlation heatmap between CDK1 and immune regulatory factors drew by TISIDB. (C–I) Correlation analysis of CDKs and CXCLs; (C) CDK1 and CXCL1; (D) CDK1 and CXCL2; (E) CDK1 and CXCL5; (F) CDK1 and CXCL6; (G) CDK1 and CXCL10; (H) CDK1 and CXCL17; (I) CDK1 and CXCL8. The data for analysis were from the LUAD project in TCGA database. (J) Fluctuation of IL8 in peripheral blood during immunotherapy in 17 lung adenocarcinoma patients. Red represents immunotherapy resistant population; green represents the immunotherapy effective population; blue represents the population in which immunotherapy efficacy could not be judged.

