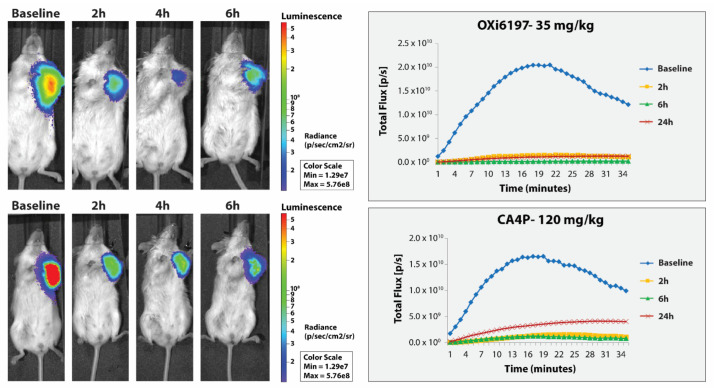
Figure 5.
Comparison of vascular disrupting activity of OXi6197 and CA4P in orthotopic MDA-MB-231-luc tumors. (Right) BLI light emission curves obtained after administering luciferin to mice at various times after VDA. Significantly reduced light emission was observed following administration of VDA. (Left) Heat maps show light emission intensity at about 12 min after administering luciferin overlaid on photographs of mice. Dose response presented in Supplementary Figures S5 and S6.

