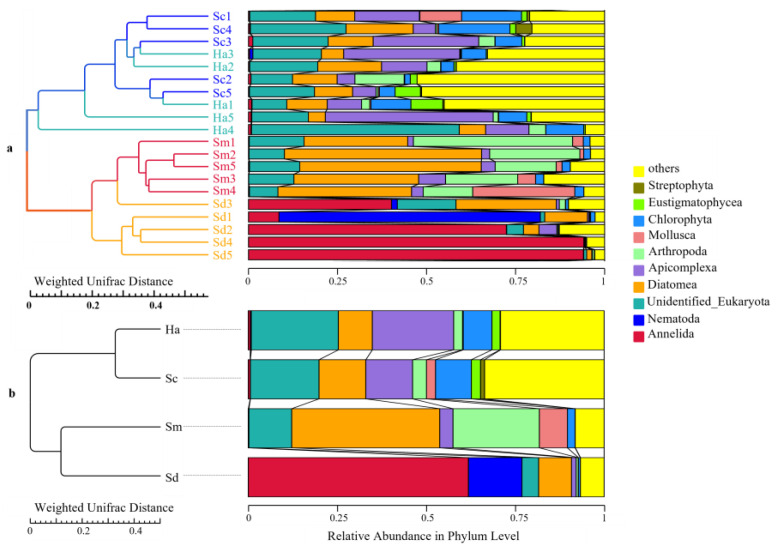
Figure 7.
UPGMA clustering tree at the level of phylum based on weighted-unifrac distance showing the similarity of eukaryotic composition among the different samples (a) and groups (b). The explanations of abbreviation in figure: Sm (S. monotuberculatus); Sc (S. chloronotus); Ha (H. atra); Sd (sediment).

