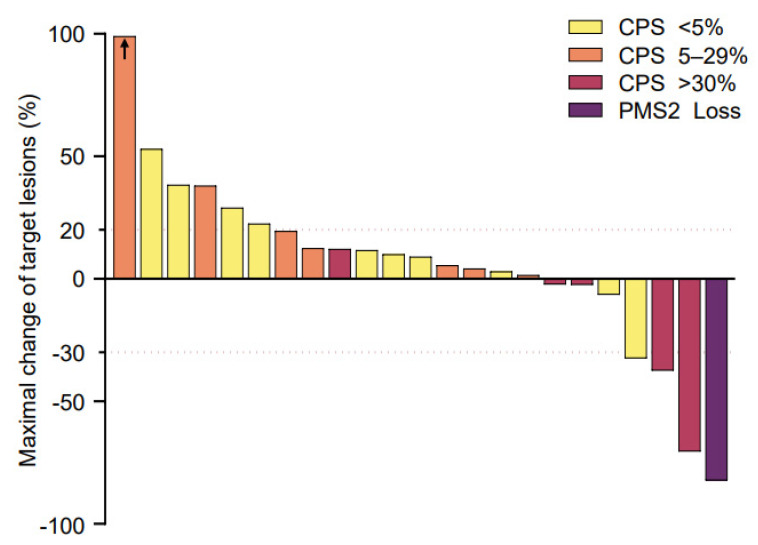
Figure 2.
Best changes in the sizes of the target lesions from the baseline for 23 patients in the phase 2a trial. The change in target lesions was calculated as the ratio to the baseline diameters measured in computed tomography (CT) images. The yellow bars indicate patients with a combined positive score (CPS) < 5%, orange bars CPS 5–29%, and red bars CPS > 30%. The purple bar indicates a patient who lost PMS2. The arrow indicates that the patient had a 169% increase in the size of the target lesion according to Response Evaluation Criteria in Solid Tumors (RECIST) version 1.1, and of the scale for the figure is inaccurate. The upper red dashed line indicates a 20% increase in the size of the target lesion from the baseline, and the lower red dashed line indicates a 30% decrease in the size of the target lesion from the baseline.

