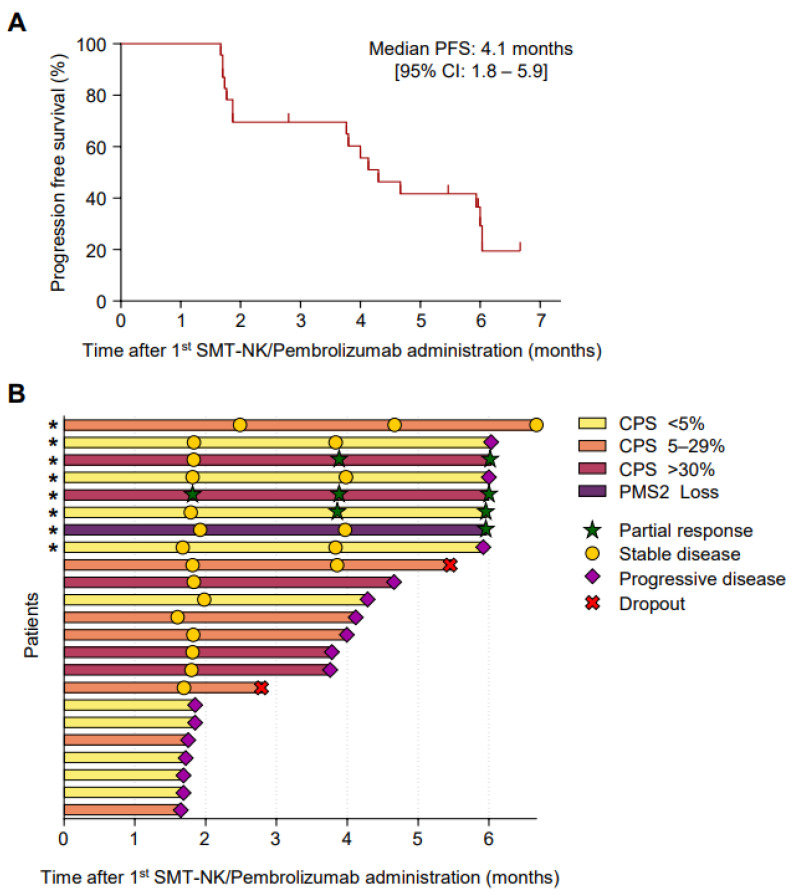
Figure 4.
Progression-free survival and time to progression for each patient. (A) Kaplan–Meier estimates of the progression-free survival in the full analysis set. (B) Time to progression. The yellow bars indicate patients with a combined positive score (CPS) < 5%, orange bars CPS 5–29%, and red bars CPS > 30%. The purple bar indicates a patient who lost PMS2. * The patient completed 27 cycles of treatment.

