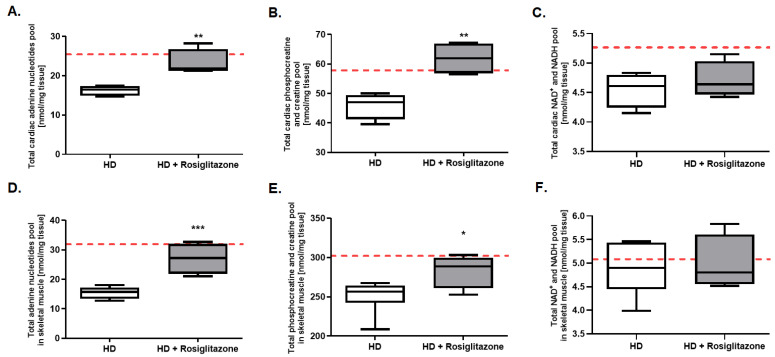
Figure 4.
Enhanced total adenine nucleotides and total phosphocreatine creatine pools in hearts and skeletal muscles of Huntington’s disease (HD) mouse model treated with rosiglitazone. Total adenine nucleotides pool in hearts (A) and skeletal muscle (D), total phosphocreatine and creatine pool in hearts (B) and skeletal muscle (E), and total NAD+ and NADH pools in hearts (C) and skeletal muscle (F) in R6/1 (HD) and R6/1 with rosiglitazone treated mice (HD + Rosiglitazone). Results presented as mean ± SEM, n = 4–6, * p < 0.05, ** p < 0.01, *** p < 0.001. The red dotted lines present the mean value of the investigated parameter in control, C57BL/6J mice (adapted from our previous works [17,42]).

