Figure 5.
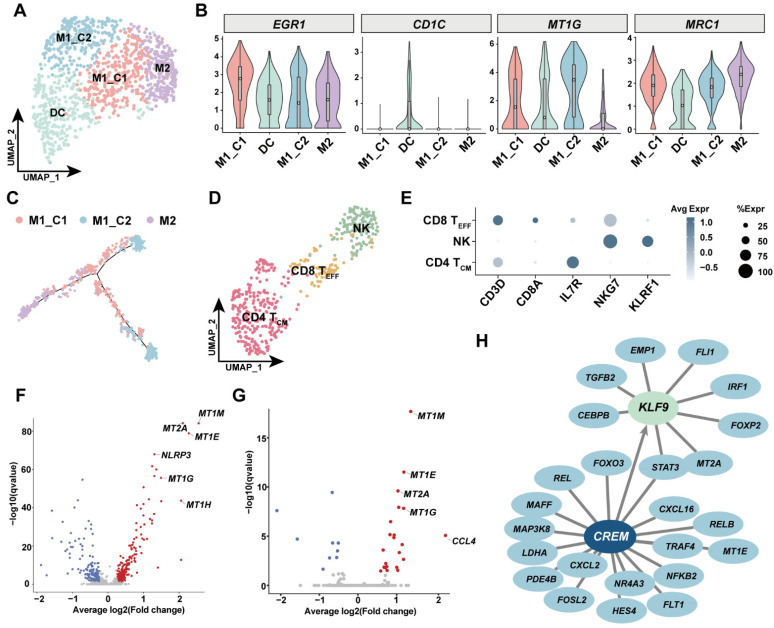
Single-cell analysis of major immune cells in human GSVs. (A) The UMAP plot of macrophages and dendritic cells in this study. DC: dendritic cells; M1_C1: proinflammatory M1 macrophage cluster 1; M1_C2: proinflammatory M1 macrophage cluster 2; M2: proreparative M2 macrophages. (B) Violin plot of signature genes for macrophages and DC subsets. (C) Trajectory analysis of three macrophage subsets. (D) The UMAP plot of T-cell subsets and natural killer cells. NK: natural killer cells. CD8 TEFF: effector CD8 T cells. CD4 TCM: central memory CD4 T cells. (E) Dot-plot of signature genes for T-cell and NK subsets. (F) Volcano plot showing the differentially expressed genes (DEG) in macrophages and DC between diabetic patients and nondiabetic patients. Red dots represent upregulated genes in diabetic patient (P2). (G) Volcano plot showing DEG in lymphocytes between P2 and P1P3. Red dots are genes upregulated in P2. (H) Network analysis inferred from SCENIC demonstrates that transcription factors CREM and KLF9 were involved in proinflammatory response in lymphocytes. KLF9 was one of the downstream targets of CREM.

