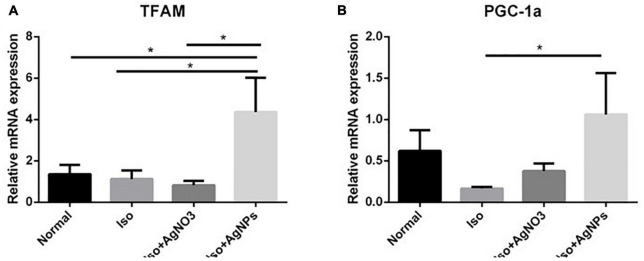
FIGURE 7.
The effects of AgNO3 and AgNPs on the mRNA expressions of TFAM (A) and PGC-1α (B). Each column represents the mean relative mRNA expression ± SEM of six rats. Data analysis was performed using one-way ANOVA, followed by Tukey multiple comparison test. *P < 0.05. Iso, isoproterenol; AgNO3, silver ion; AgNPs, silver nanoparticles.

