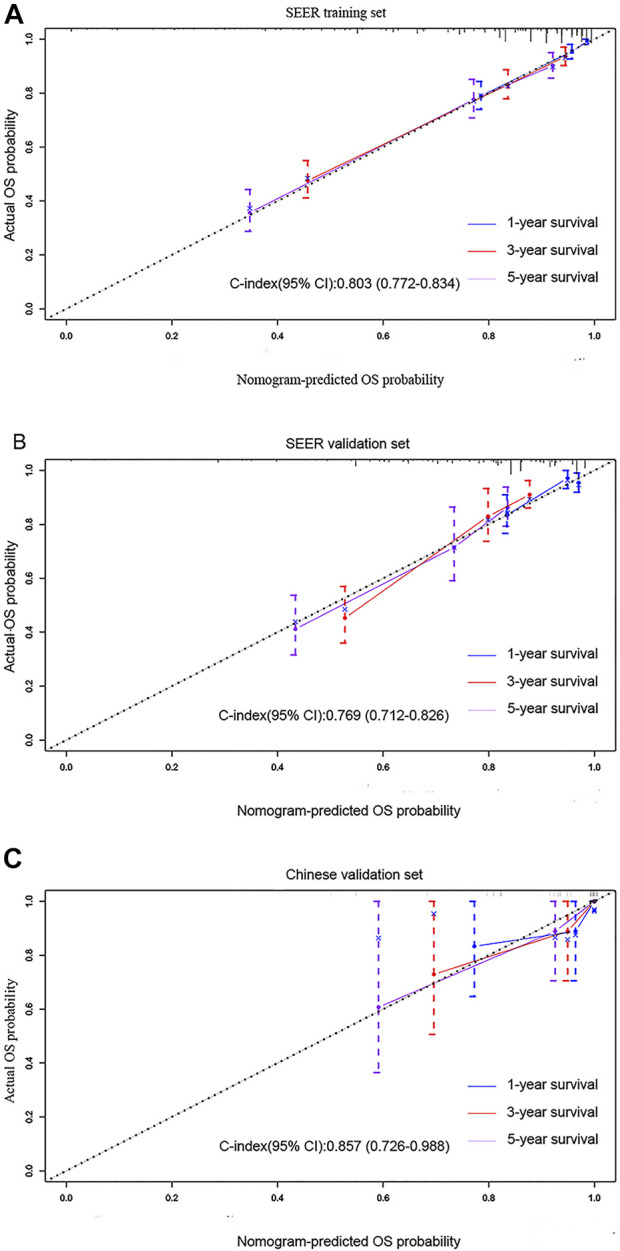
FIGURE 4.

Calibration curves predicting the 1-, 3-, and 5-years OS of patients in the (A) training cohort, (B) SEER validation set, and (C) multicenter validation set. The x-axis plots the predicted survival probability, and the y-axis indicates the actual survival probability. The 45-degree inclined curve indicates that the predicted probability is in line with the actual probability.
