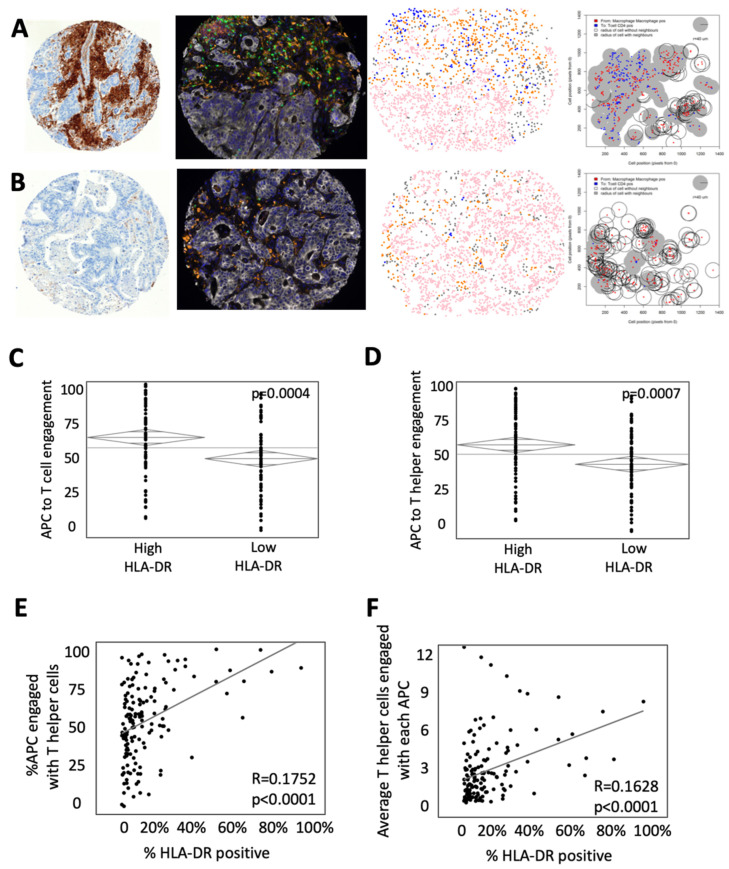
Figure 2.
High HLA-DR expression is associated with increased engagement of T cells and antigen present cells (APCs). (A) Representative example of a tumor with high HLA-DR expression (Left to right: (a) immunohistochemistry for HLA-DR, (b) composite multiplex immunohistochemistry image stained for CD3—green, CD163—orange, CD8—yellow, pancytokeratin—white, FoxP3—red, PD-L1—magenta and DAPI—blue, (c) phenotypic map depicting the location of CD3+ T cells (blue), pancytokeratin-positive epithelial cells (pink), CD163+ antigen-presenting cells (orange) and other cells (gray), (d) cell engagement analysis between antigen-presenting cells (red) and T helper cells (blue) with the shaded area representing engaged cells.) (B) Representative example of a tumor with low HLA-DR expression with images as described above. ANOVA analysis of the percent of APCs engaged with (C) T cells and (D) T helper cells. Bivariate comparison of the percentage of HLA-DR positivity by surface area and engagement with (E) T cells and (F) T helper cells.

