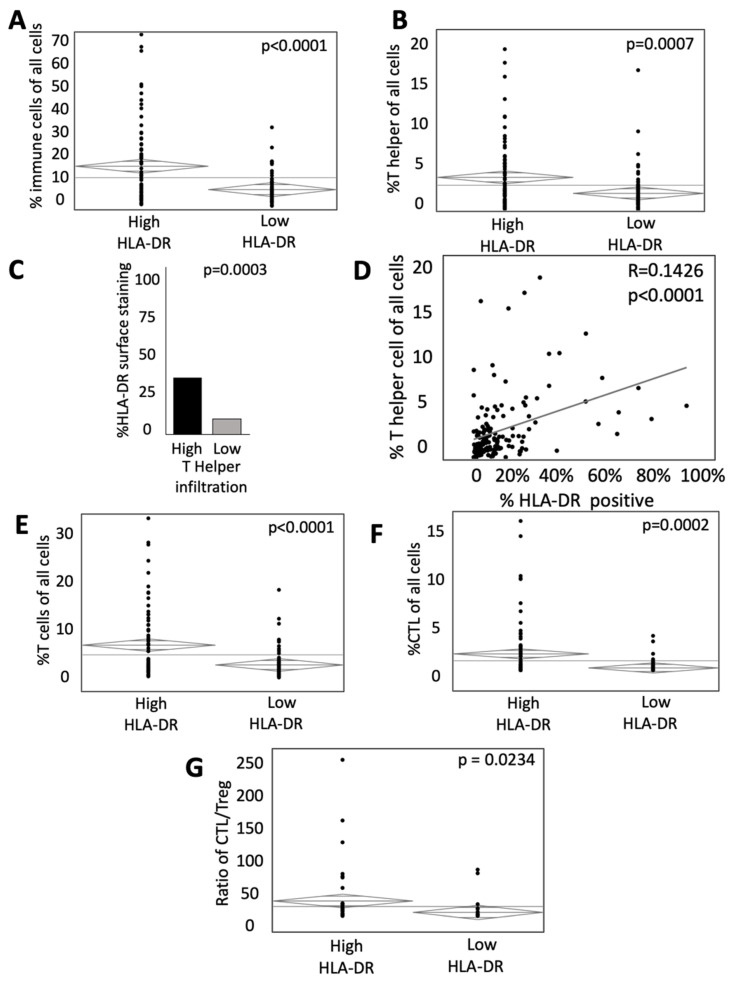
Figure 4.
HLA-DR expression influences the proportion of activated immune cells in the TME. (A) ANOVA analysis of the percent of immune cells (CD3+ T cells and CD163+ APCs) relative to all cells in high and low HLA-DR expressing tumors. (B) ANOVA analysis of the percent of T helper cells relative to all cells in high and low HLA-DR expressing tumors. (C) Percent surface area of HLA-DR staining in patients with high (upper quartile) and low (lowest quartile) T helper cell infiltration. (D) Bivariate analysis of HLA-DR-positive surface area and percentage of T helper cells of all cells. Relative abundance of (E) total T cells and (F) cytotoxic T cells in high and low HLA-DR-expressing tumors.

