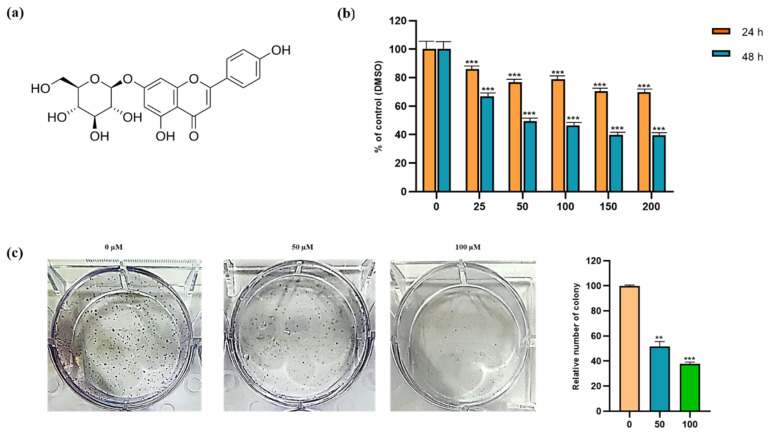
Figure 1.
Cytotoxic and inhibitory effects of compound apigetrin. (a) Structure of apigetrin. (b) Hep3B cells were incubated with different concentrations (0, 25, 50, 100, 150, and 200 µM) of apigetrin for 24 and 48 h. The control group (0 μM) was treated with the same amount of DMSO. *** p < 0.001 vs. control. (c) Hep3B cells were treated with indicated concentrations (0, 50, and 100 µM) for 10 days and further stained with Giemsa solution to determine the survival percentage of colony formation in Hep3B cells after treatment with apigetrin. Results obtained from three independent experiments were expressed as mean ± standard deviation (SD) compared with the control group. ** p < 0.01 vs. control; *** p < 0.001 vs. control.

