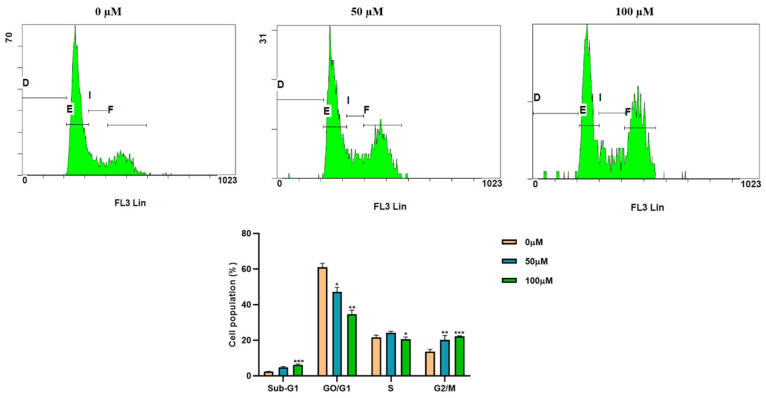
Figure 2.
Cell cycle analysis by flow cytometry. Hep3B cells were treated with indicated concentrations (0, 50, and 100 µM) of apigetrin for 48 h, stained with PI, and cell cycle distribution was analyzed by flow cytometry. Values are given as mean ± standard deviation (SD) of three independent experiments. * p < 0.05 vs. control; ** p < 0.01 vs. control; *** p < 0.001 vs. control.

