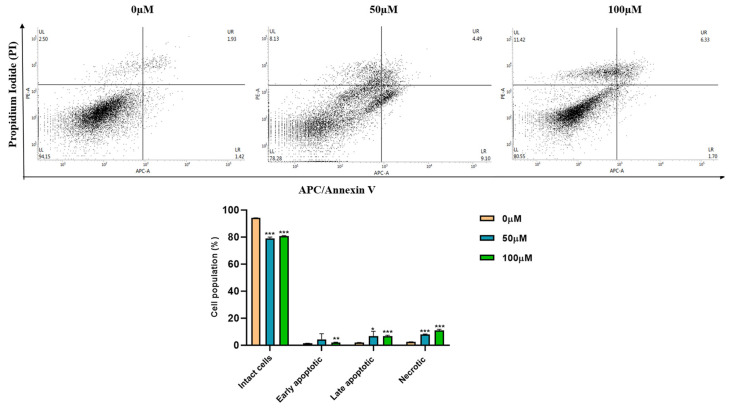
Figure 3.
Double staining analysis by flow cytometry. Hep3B cells were treated with different concentrations (0, 50, and 100 µM) of apigetrin for 48 h. After allophycocyanin (APC)/Annexin V and propidium iodide (PI) double-staining was done cells were analyzed by flow cytometry. Values are given as mean ± standard deviation (SD) of three independent experiments. * p < 0.05 vs. control, ** p < 0.01 vs. control, *** p < 0.001 vs. control.

