FIG. 4.
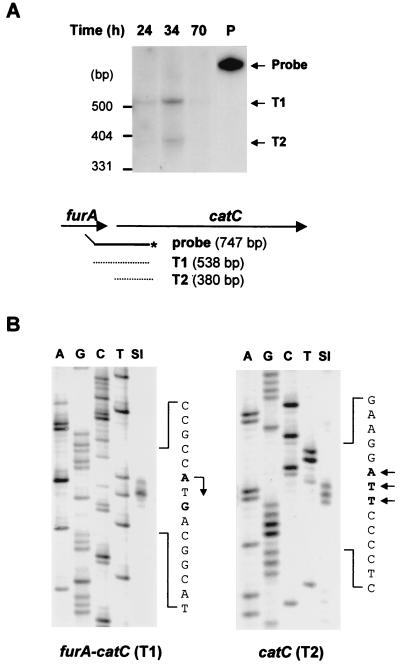
Analysis of furA and catC mRNAs by S1 nuclease mapping. RNA was prepared from S. coelicolor A3(2) M145 cells grown in YEME medium for various lengths of time as indicated. (A) S1 nuclease mapping analysis was done with the 747-bp PvuII/NarI probe uniquely labeled at the NarI site. Two protected bands (T1 and T2) are indicated by arrows. Schematic representations of the probe and protected fragments are also indicated. (B) High-resolution S1 mapping of 5′ ends of the furA-catC transcripts. For mapping the 5′ end of the T1 transcript, the 415-bp probe uniquely labeled at the 5′ end of FS1 (Fig. 1 [at position +92 relative to the furA start codon]) was used. A DNA sequencing ladder was generated with primer FS1. For mapping the 5′ end of the T2 transcript, the 856-bp probe uniquely labeled at the 5′ end of CS1 (Fig. 1 [at position +47 relative to the catC start codon]) was used. A DNA sequencing ladder was generated with primer CS1. The positions of transcript 5′ ends are designated in boldface type and by arrows on the sense sequence.

