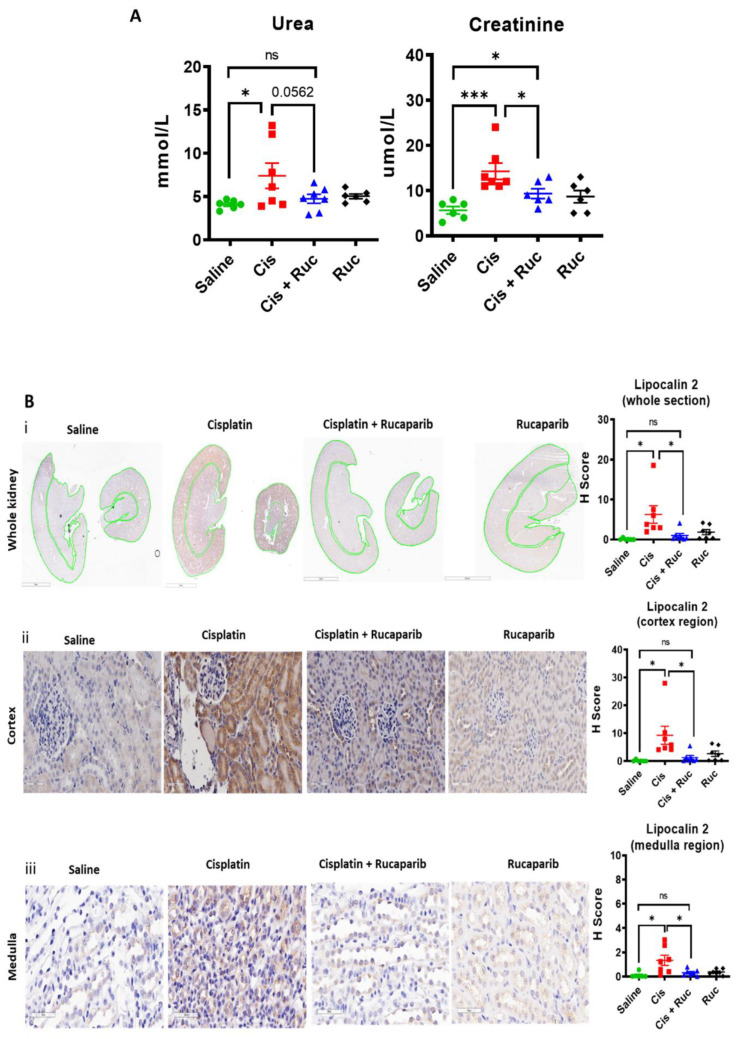
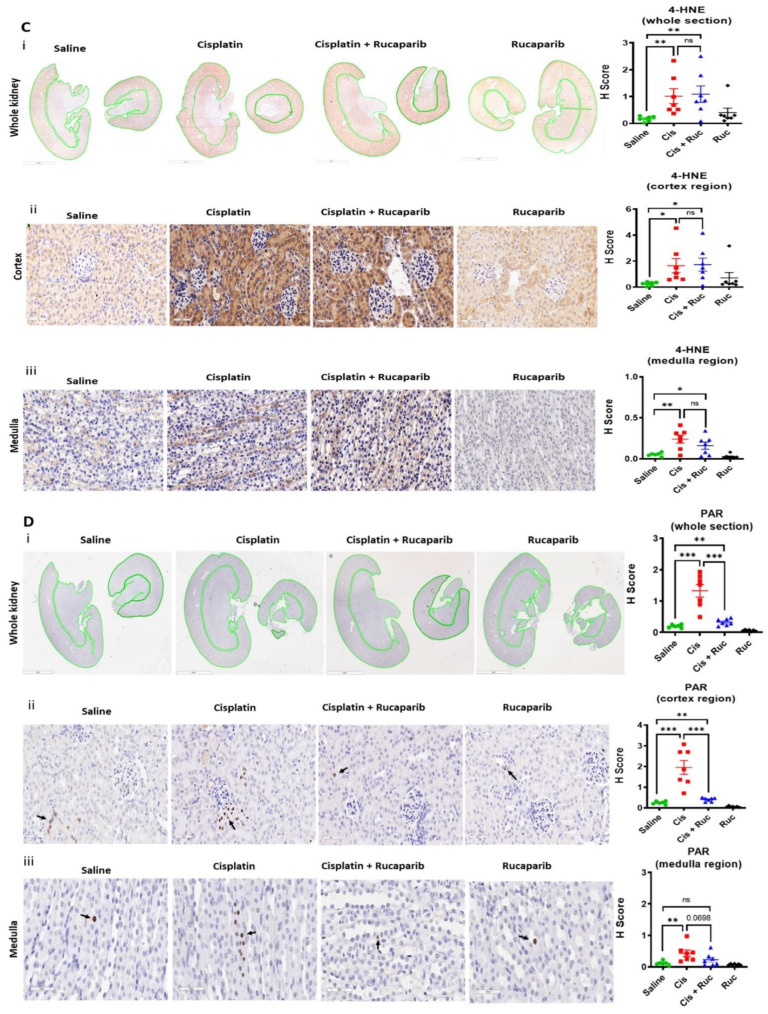
Figure 5.
Cisplatin-induced-acute kidney injury is associated with PARP activation and is prevented by rucaparib: Mice were treated with a single dose of 10 mg/kg cisplatin (Cis) on day 1 with or without 5 daily doses of 1 mg/kg rucaparib (Ruc). At the end point (day 5), mice were humanly killed, and blood and kidney tissues were harvested for analysis. (A) Blood urea and creatinine levels. Each data point is from a single mouse (N =≥ 6 mice per group). The difference of urea and creatinine levels between saline and cisplatin ± rucaparib treated groups were compared using unpaired t-test, ns = nonsignificant, * and *** are p < 0.05 and 0.001 respectively. (B) Representative images of kidney toxicity biomarker lipocalin- 2 expression. IHC images were scanned under the Aperio image scanner and staining intensities (H-score) were quantified for the sections as a whole, cortex and medulla regions separately. (i) Whole kidney sections (0.9× magnification, 3 mm scale bar and the green lines are drawn to separate cortex and medulla regions for quantification), (ii) cortex and (iii) medulla regions (40× magnification, 50 µM scale bar). Each data point is from a single mouse (N =≥ 6 mice per group). The difference of lipocalin-2 expression between saline and cisplatin ± rucaparib treated groups were compared using unpaired t-test, ns = nonsignificant and * is p < 0.05. (C) Representative images of oxidative stress biomarker 4-HNE expression. IHC images were scanned under the Aperio image scanner and staining intensities (H-score) were quantified for the sections as a whole, cortex and medulla regions separately. (i) Whole kidney sections (0.9× magnification, 3 mm scale bar and the green lines are drawn to separate cortex and medulla regions for quantification), (ii) cortex and (iii) medulla regions (40× magnification, 50 µM scale bar). Each data point is from a single mouse (N =≥ 6 mice per group). The difference of 4-HNE expression between saline and cisplatin ± rucaparib treated groups were compared using unpaired t-test, ns = nonsignificant, * and ** are p < 0.05 and 0.01. (D) Representative images of PARP activation, measured by PAR expression (PAR positive cells are indicated with arrows). IHC images were scanned under the Aperio image scanner and staining intensities (H-score) were quantified for the sections as a whole, cortex and medulla regions separately. (i) whole kidney sections (0.9× magnification, 3 mm scale bar and the green lines are drawn to separate cortex and medulla regions for quantification), (ii) cortex and (iii) medulla regions (40× magnification, 50 µM scale bar). Each data point is from a single mouse (N =≥ 6 mice per group). The difference of PAR expression between saline and cisplatin ± rucaparib treated groups were compared using unpaired t-test, ns = nonsignificant, ** and *** are p < 0.01and 0.001.


