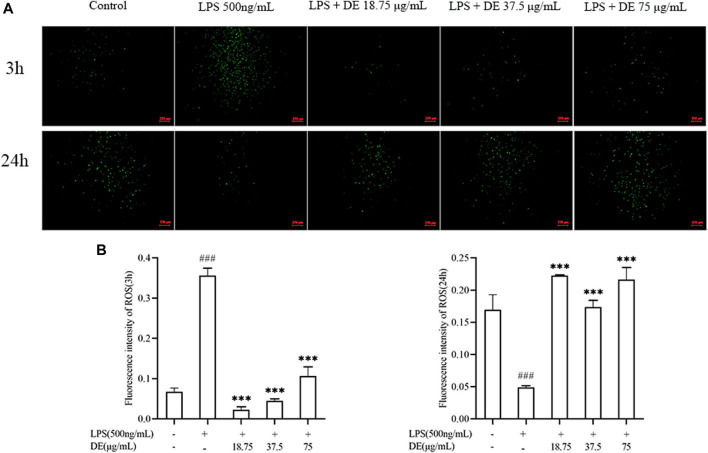
FIGURE 4.
DE reduced ROS production after LPS stimulation (×40). Cells were pretreated with DE for 2 h and then stimulated with LPS (500 ng/ml) for another 3 h or 24 h. Fluorescence microscopy was used to take pictures (A) and the fluorescence intensity of ROS for 3 h (B) or 24 h (C) was obtained by analysis with Image J software. Compared with the control group, ### p < 0.001; compared with the LPS group, ***p < 0.001.

