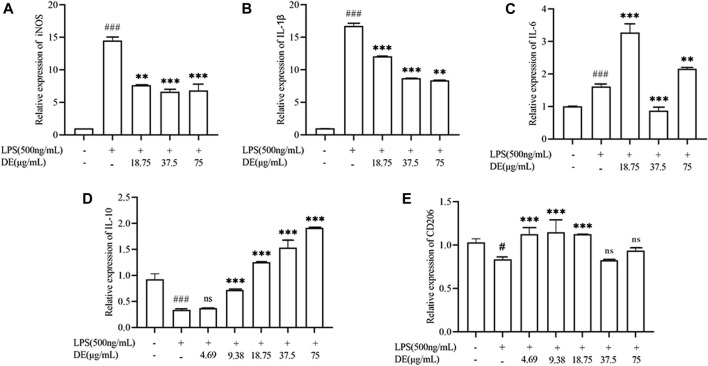
FIGURE 7.
Modulation of LPS-stimulated polarization of RAW264.7 cells by DE. Cells were pretreated with DE (4.69, 9.38, 18.75, 37.5, and 75 μg/ml) for 2 h and then stimulated with LPS (500 ng/ml) for another 36 h. The expression levels of M1 phenotype genes (IL-1β, IL-6, and iNOS) (A–C), and M2 phenotype genes (CD206, IL-10) (D,E) were obtained by RT-PCR. Compared with the control group, ### p < 0.001, # p < 0.05; compared with the LPS group, ***p < 0.001, **p < 0.01.

