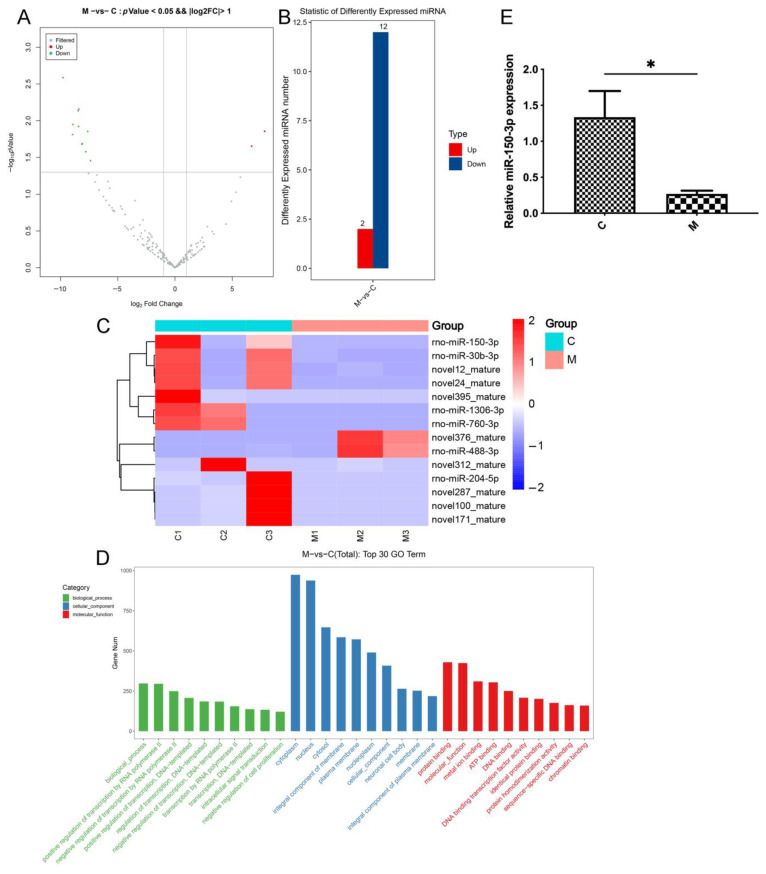
Figure 3.
RNA sequencing analyzed DE miRNAs in EVs between the control (C) and model (M) groups. (A) Volcano plot of differentially present miRNAs. Gray indicates the miRNAs present at similar levels between the two groups; red indicates the significantly higher presence of miRNAs; and green indicates the significantly lower presence of miRNAs; X-axis is log2 Fold Change, and Y-axis is −log10 p-value. p < 0.05, |log2 fold change| > 2. (B) Fourteen miRNAs were significantly differentially depicted, including twelve upregulated and two downregulated miRNAs. (C) Heatmap of the DE miRNAs. Red and blue indicate high and low levels, respectively. (D) Gene ontology analyses were performed. (E) qPCR validation of the miR-150-3p enrichment in the EVs. Three independent experiments indicate the data as mean ± SEM (n = 3). * p < 0.05.

