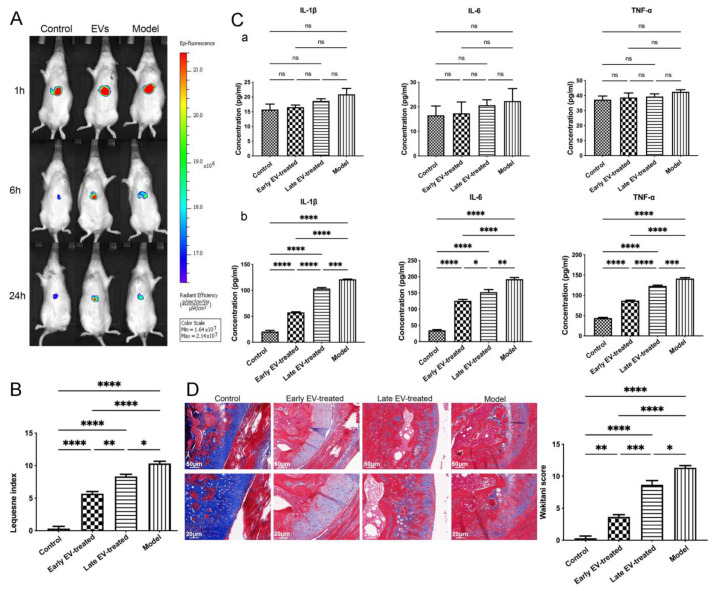
Figure 10.
In vivo tracking and role of H-FLS–EVs in the joint homeostasis. (A) In vivo EV tracking using live imaging. (B) Lequesne index of rats’ behavior. (C) ELISA-based quantitation of the pro-inflammatory cytokines IL-1β, IL-6, and TNF-α in serum (a) and synovial fluid (b). (D) Histological analysis of EV-treated AC using Masson’s staining. The data are expressed as mean ± SEM from three independent experiments. **** p < 0.00001, *** p < 0.0001, ** p < 0.01, * p < 0.05; ns, not significant.

