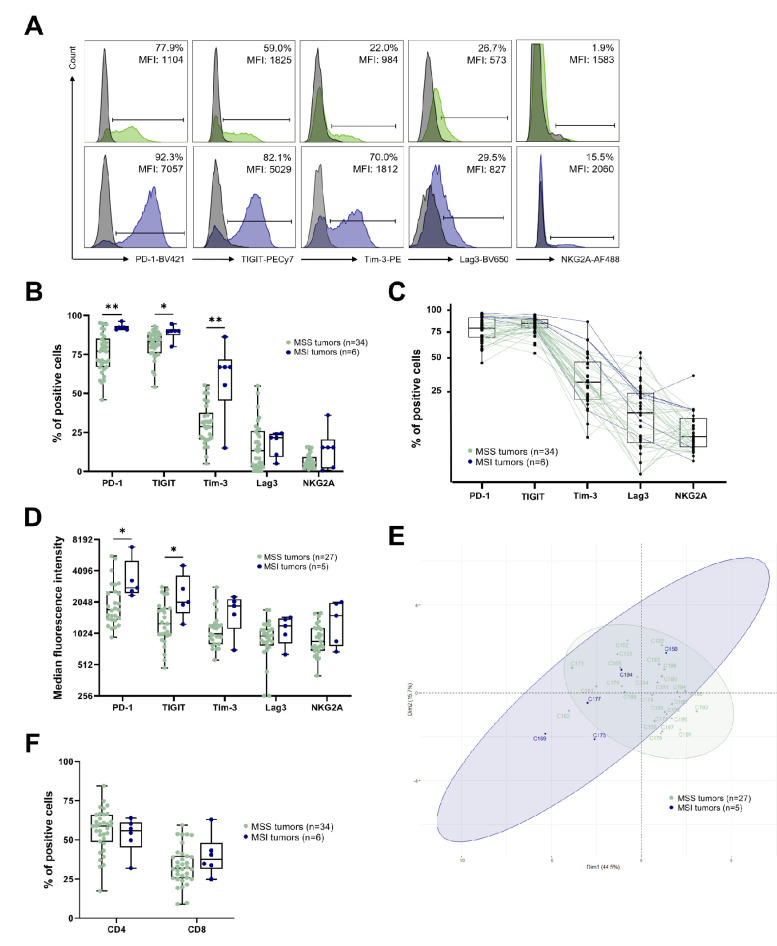
Figure 1.
Expression of IC by CD3+ TILs from CRC tumors according to the microsatellite status. For each figure, data were analyzed according to the MSS/MSI status, with MSS tumors shown in pale green and MSI tumors in dark blue. (A) Representative histograms showing the expression of PD-1, TIGIT, Tim-3, Lag3 and NKG2A on CD3+ TILs from an MSS patient (upper panels) or from an MSI patient (lower panels). Results were expressed as positive cells and median fluorescence intensity (MFI). Isotypic controls are overlaid in grey. (B) Frequency of PD-1+, TIGIT+, Tim-3+, Lag3+ and NKG2A+ cells among CD3+ TILs (n = 40, cohorts 1, 2 and 3); Mann–Whitney test (* p < 0.05; ** p < 0.01). (C) Pairwise frequency of PD-1+, TIGIT+, Tim-3+, Lag3+ and NKG2A+ cells among CD3+ TILs (n = 40, cohorts 1, 2 and 3). (D) Expression level (MFI, scale in log2) of PD-1, TIGIT, Tim-3, Lag3 and NKG2A on positive IC CD3+ TILs (n = 32, cohorts 2 and 3); Mann–Whitney test (* p < 0.05). (E) Principal component analysis of tumors from cohorts 2 and 3 (n = 32) based on the frequency and MFI of the 5 ICs on CD3+ TILs. (F) Proportion of CD4+ and CD8+ cells among CD3+ TILs (n = 40, cohorts 1, 2 and 3); Mann–Whitney test.

