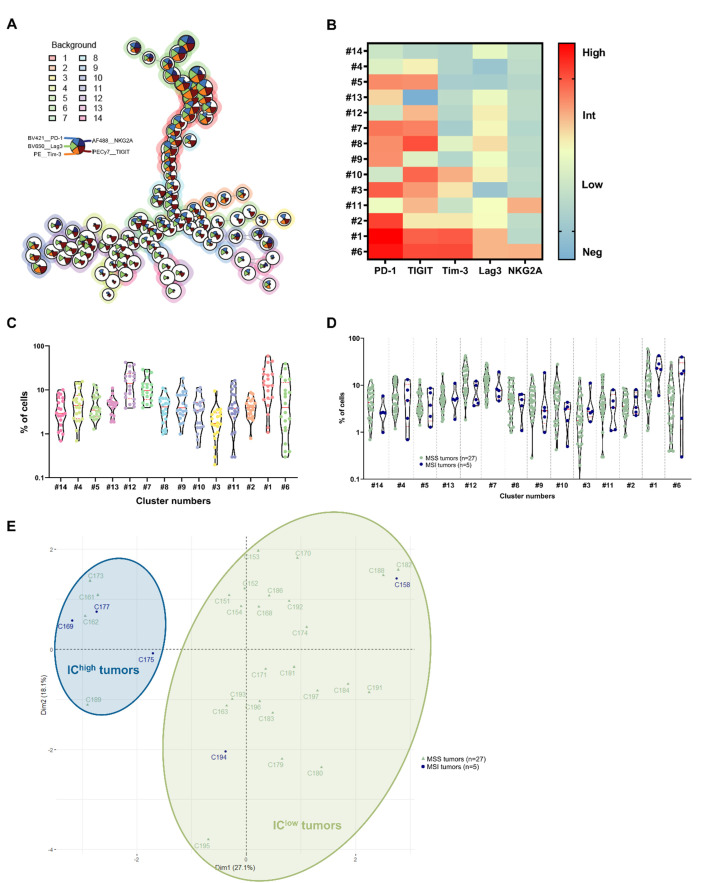
Figure 3.
Identification of 14 CD8+ TIL clusters based on differential expression of ICs. (A) FlowSOM tree of CD8+ TILs from cohort 2 tumors (n = 20). The background coloring represents meta-clustering and the legends of the star plot and meta-clustering are shown on the right side. (B) Heatmap of the MFI of the PD-1, TIGIT, Tim-3, Lag3 and NKG2A markers expressed, or not expressed, by the 14 clusters identified in the CD8+ TIL population generated from cohort 2 tumors (n = 20). (C) Cell frequency in each CD4+ TIL cluster generated from cohort 2 tumors (n = 20). (D) Cell frequency in each CD4+ TIL cluster generated from cohort 2 and 3 tumors (n = 32) according to the MSS/MSI status (pale green and dark blue, respectively). The clusters of the two cohorts were merged and the cluster numbering from cohort 2 was retained; Mann–Whitney tests. (E) Principal component analysis of tumors from cohorts 2 and 3 based on cell frequencies in each generated CD8+ TIL cluster, with MSS tumors are in pale green triangles and MSI tumors in dark blue circles. Ellipses were drawn to highlight two new groups of colorectal tumors: the IChigh group (in dark blue) and the IClow group (in pale green).

