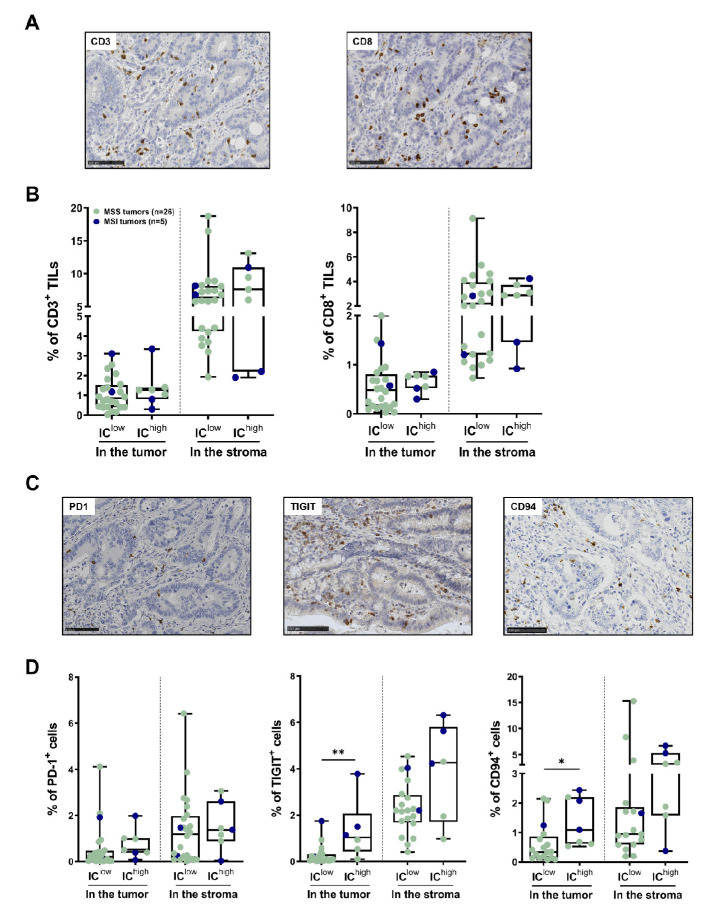
Figure 4.
In situ assessment of T-cell density and IC expression profile using immunohistochemistry in the IChigh/low subgroups of CRC identified via flow cytometry. (A) Representative CD3 (left) and CD8 (right) immunostaining of an MSS CRC with an IChigh expression profile. Stained cells appear in brown within tumor glands and in the surrounding stroma; nuclei are counterstained in blue. Bars indicate 100 μm. (B) Box plots in the lower panels indicate the percentages of CD3+ or CD8+ TILs counted inside tumor glands (intraepithelial TILs) or in the peritumoral stroma using QuPath software, according to IClow or IChigh subgroups; Mann–Whitney test. MSS tumors are shown in pale green and MSI tumors in dark blue. (C) Representative immunostaining of PD-1, TIGIT and CD94 of the same MSS CRC with an IChigh expression profile, as in (A). Numerous TIGIT+ TILs can be seen within the tumor and in the stroma, and only a few PD-1+ cells and CD94+ TILs. Bars indicate 100 μm. (D) Box plots recapitulate the percentages of cells expressing PD-1, TIGIT or CD94, counted inside tumor glands (intraepithelial TILs) or in the peritumoral stroma using QuPath software, according to IClow vs. IChigh subgroups; Mann–Whitney test (* p < 0.05; ** p < 0.01). MSS tumors are shown in pale green and MSI tumors in dark blue.

