Figure 5.
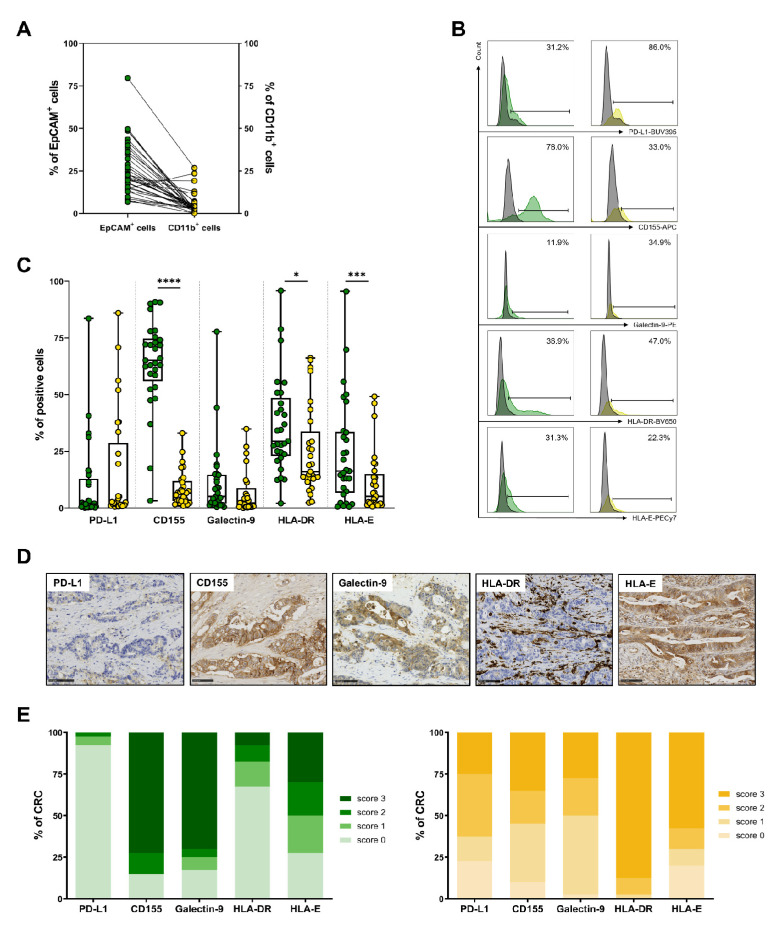
Expression profile of IC ligands by tumor cells and myeloid cells from CRC tumors, determined using flow cytometry and immunohistochemistry. For flow cytometry data (A–C), EpCAM+ tumor cells are shown in green and CD11b+ myeloid cells in yellow. (A) Paired frequency of EpCAM+ and CD11b+ cells among viable cells in CRC tumors (n = 29). (B) Representative histograms of the expression of PD-L1, CD155, galectin-9, HLA-DR and HLA-E in EpCAM+ cells (left) and in CD11b+ cells (right). Results are expressed as percentages of positive cells, and isotypic controls are overlaid in grey. (C) Frequency of PD-L1+, CD155+, galectin-9+, HLA-DR+ and HLA-E+ cells among EpCAM+ or CD11b+ cells (n = 29), determined using flow cytometry; Wilcoxon paired t-test (* p < 0.05; *** p < 0.001; **** p < 0.0001). (D) Representative immunostaining of IC ligands on an MSS tumor, showing strong expression of CD155, galectin-9 and HLA-E by tumor cells and, conversely, no expression of PD-L1 or HLA-DR. HLA-DR-positive immune cells can be seen surrounding tumor cells. Bars indicate 100 μm. (E) Percentages of CRC scoring positive for each IC ligand mentioned on the x axis. The semi-quantitative scores used (0 to 3; see Materials and Methods section) appear in green for tumor cells (left) and in yellow for immune cells of the stroma (right).

