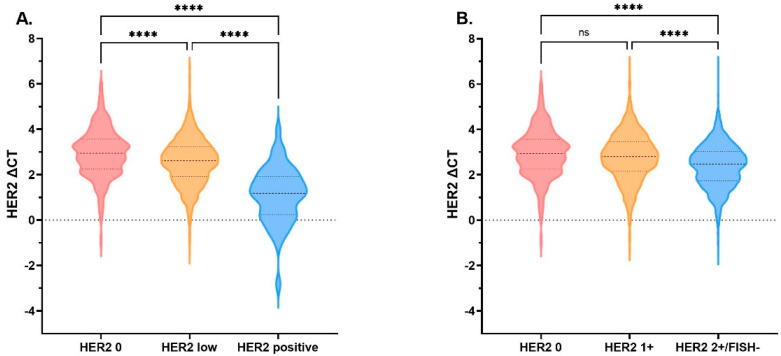
Figure 2.
HER2 mRNA expression by HER2 IHC/FISH status. HER2 mRNA expression tested by qRT-PCR assay, adjusted by endogenous genes β-actin, GAPDH, GUS, RPLPO, and TFRC. (A) The medians of ΔCT were 2.94 (n = 368; Q1–Q3: 2.25–3.57), 2.61 (n = 1928; Q1–Q3: 1.90–3.23), and 1.18 (n = 48; Q1–Q3: 0.24–1.90) for HER2 0, HER2-low, and HER2-positive cases, respectively. (B) The medians of ΔCT were 2.94 (n = 368; Q1–Q3: 2.25–3.57), 2.80 (n = 911; Q1–Q3: 2.16–3.46), and 2.47 (n = 1017; Q1–Q3: 1.74–3.03) for HER2 0, HER2 1+, and HER2 2+/FISH− cases, respectively. No statistically significant difference in HER2 mRNA expression was detected between HER2 0 and HER2 1+ cases (p= 0.063); however, HER2 expression of HER2 2+/FISH− was significantly higher than HER2 0 (p < 0.0001) and HER2 1+ (p < 0.0001). **** p < 0.0001. The thick dotted line denotes the median, the thin dotted line denotes inter-quartile range. Abbreviations: HER2, human epidermal growth factor receptor 2; mRNA, message ribonucleic acid; IHC, immunohistochemistry; FISH, fluorescence in situ hybridization; qRT-PCR, quantitative reverse transcriptase-polymerase chain reaction; CT, cycle threshold; ns, not significant.

