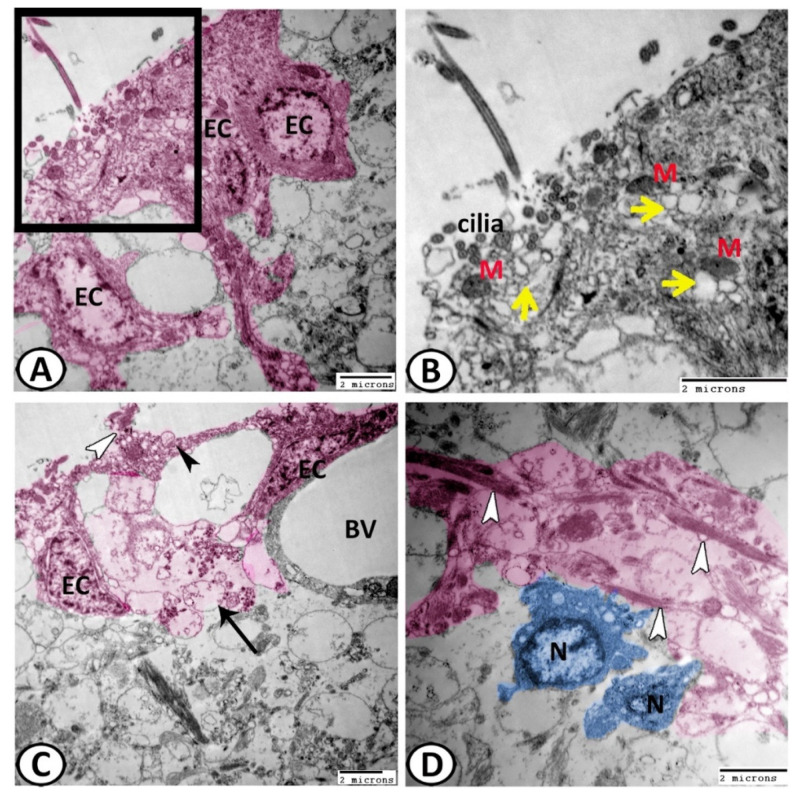
Figure 6.
Digital colored transmission electron microscopy (TEM) of EC (pink). (A,B) The ciliated ECs were covered by cilia and their apical cytoplasm showed many mitochondria (M) and many vesicles of different shapes (yellow arrowheads). (C) The non-ciliated ECs showed bleb-like protrusions (white arrowhead) containing clear vesicles (black arrowhead). Some non-ciliated ECs were branched to encircle the nearby blood vessels (BV). The ECs gave off collateral projections that were associated with the synapse (black arrow). (D) Distinct glia–neuron interactions were observed between the processes of ECs (white arrowheads) with the progenitor neuronal cells (N, blue).

