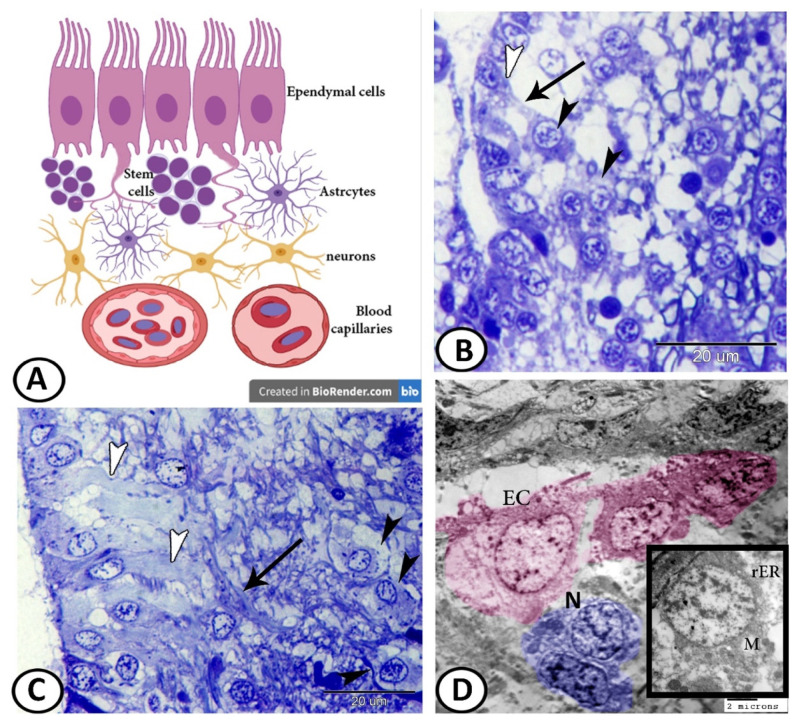
Figure 10.
Glia–neuron interaction dynamics. (A) Schematic representation of the composition of the ventricular layer of neurogenic niches. (B,C) Periventricular neurons (black arrowheads) extended their axons (arrow) to the cell processes of ECs (white arrowheads). (D) Digital colored TEM image showing the connection between ECs and neurons (N, boxed area), showing mitochondria (M) and rER.

