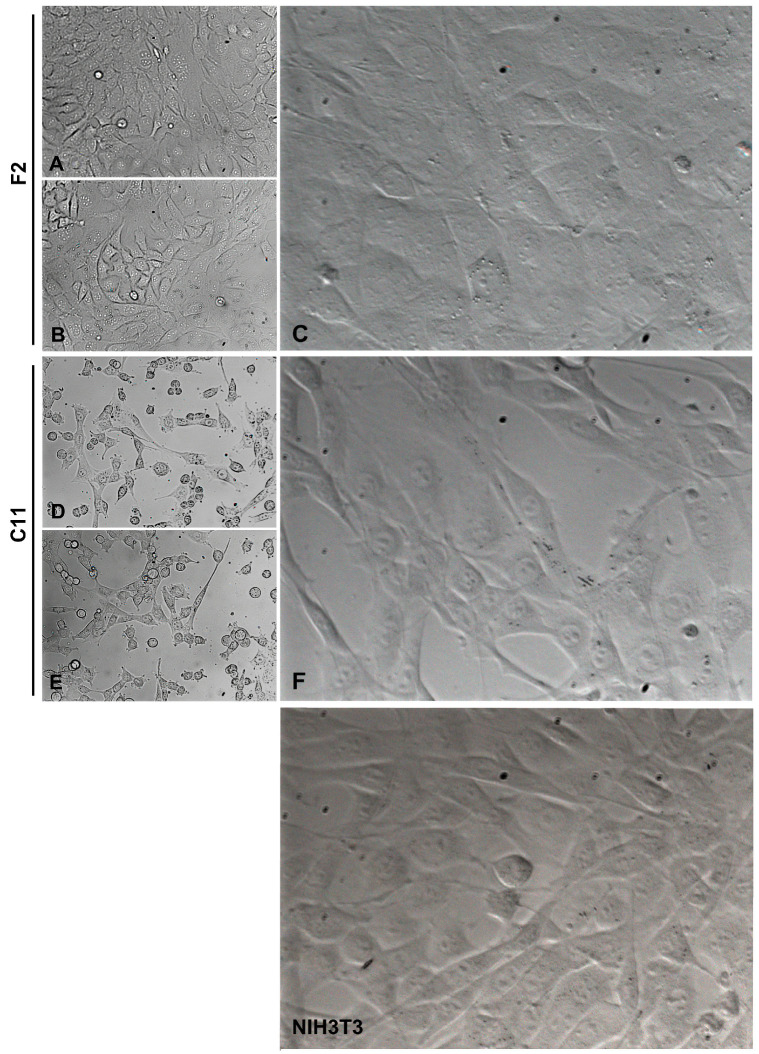
Figure 2.
Different morphologies of sub-cell lines F2 and C11 derived from the NIH3T3 whole-cell population. F2 cells represented cubic-shaped fibroblasts, and C11 cells represented fiber-shaped fibroblasts. For comparison, the morphologies in the original NIH3T3 cell population are shown (NIH3T3). (A,B,D,E) are taken under 10× lens magnification, (C,F), and NIH3T3 are taken under 20× lens magnification. The cells were cultured in a standard medium containing 10% FCS.

