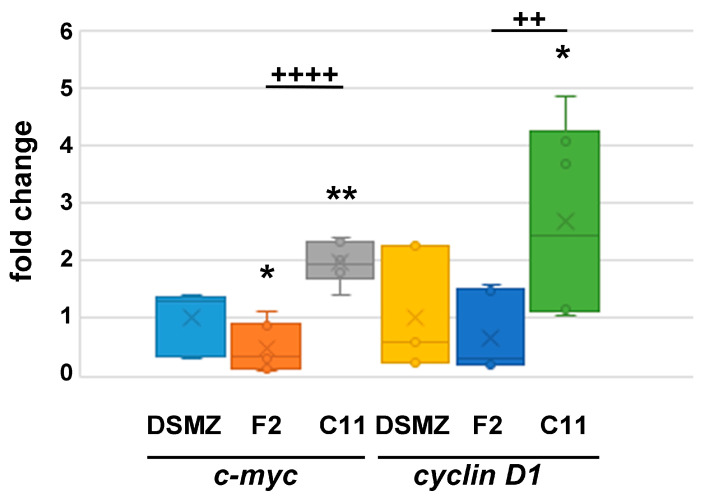
Figure 7.
Quantitative expression of c-myc and cyclin D1 in proliferating cells. The cells were cultivated under proliferating conditions. The relative expression was calculated by ΔΔCt using ‘DSMZ’ cells as the reference. NIH3T3 sub-cell line C11 showed increased expression of c-myc (p < 0.01 **) and cyclin D1 (p < 0.05 *), whereas F2-cells showed a reduced expression of c-myc (p < 0.05 *). Compared to F2 cells, C11 cells have a significantly higher expression of c-myc (p < 0.0001 ++++) and cyclin D1 (p < 0.01 ++).

