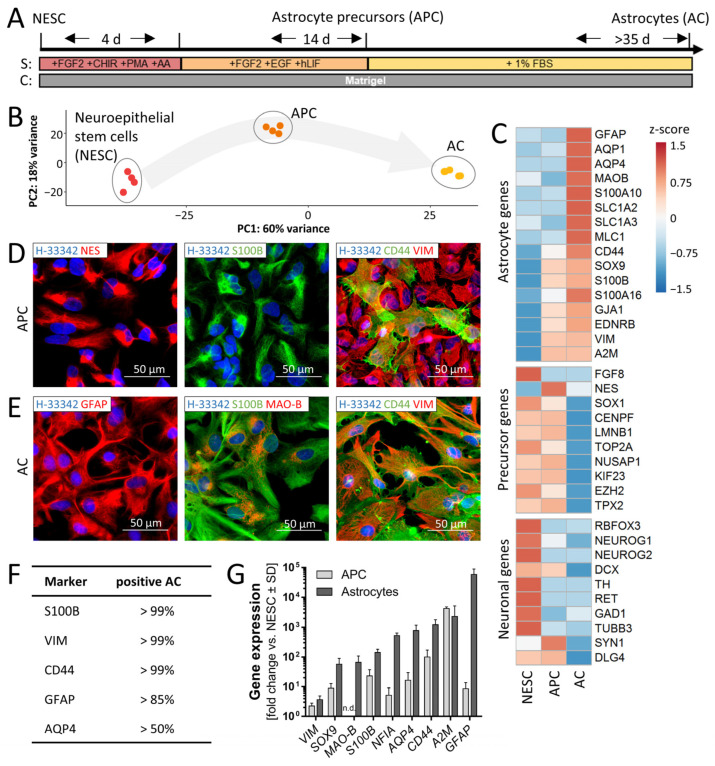
Figure 1.
Generation and characterization of human astrocytes. (A) Schematic differentiation of astrocytes (ACs) from neuroepithelial precursor cells (NESCs) via astrocyte precursor cells (APCs). NESCs were thawed and differentiated to APCs in two steps. For the first four days, the medium contained fibroblast growth factor (FGF2), the Wnt activator (CHIR99021), the smoothened receptor agonist purmorphamine (PMA) for activation of the hedgehog pathway and the antioxidant ascorbic acid (AA) as supplements (S). In the second phase (14 d), the medium was supplemented with FGF2, epidermal growth factor (EGF) and human leukemia inhibitory factor (hLIF). APCs were differentiated towards ACs with 1% fetal bovine serum (FBS) as medium supplement. ACs were considered mature after at least 35 days of differentiation from APCs. (B) The gene expression of NESCs, APCs and ACs was quantified for a panel of 3562 genes (four samples each). In the 2-dimentional display of the principal component analysis (PCA), the axes are scaled according to the variance explained by the respective PCA component. (C) Heat map depicting the row-wise z-scores of expression levels of selected marker genes in NESCs, APCs and ACs. Data are derived from mean expression levels (in counts per million reads) with n = 4. (D) APCs were fixed and immunostained for typical astrocyte precursor markers: nestin (NES), S100B, CD44 and vimentin (VIM). Nuclei were counterstained with the DNA stain Hoechst-33342 (H-33342). (E) Mature ACs were fixed and immunostained for typical astrocyte markers: GFAP, S100B, monoamine oxidase B (MAO-B), CD44 and vimentin (VIM). Nuclei were stained with H-33342 (blue). Representative epifluorescence images of typical expression patterns and morphologies are shown in (D,E). Pseudocoloring of antigens is indicated in image legends. (F) Quantification of the percentage of marker-positive ACs after ≥35d. Three independent AC differentiations were used for imaging and three fields per differentiation were scored. Cells (70/field) were randomly picked in the H-33342. (G) AC marker expression was confirmed by RT-qPCR gene expression analysis in APCs (14 d) and ACs (35 d). Data are means ± SD of ≥3 independent differentiations. Gene expression data (RT-qPCR) for later time points of AC differentiation can be found in Figure S1A. n.d., not detected.

