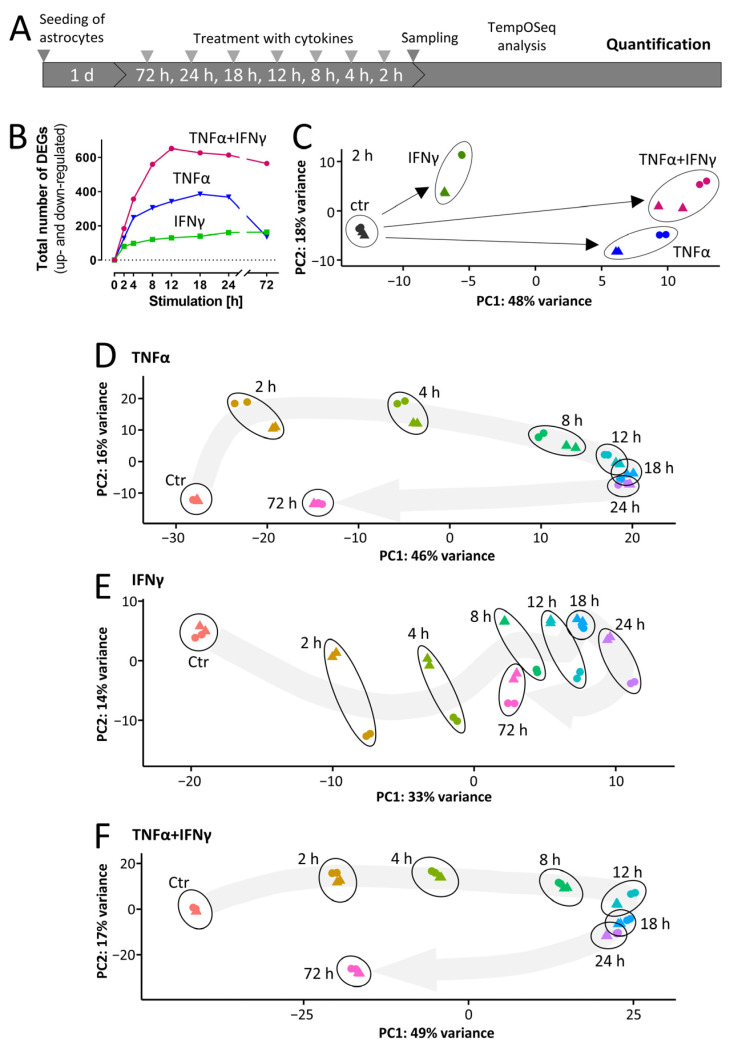
Figure 4.
Dynamics of cytokine-induced gene expression in ACs. (A) Schematic representation of the experimental procedure for AC sample generation and targeted RNASeq analysis (TempOSeq method). ACs were seeded at a density of 50,000 cells/cm2 into 96-well plates. On the following days, cells were stimulated with TNFα (10 ng/mL), IFNγ (20 ng/mL) or a combination of TNFα (10 ng/mL) plus IFNγ (20 ng/mL). After the indicated time periods, cells were lysed and gene expression profiling was performed for 3562 genes. (B) The total numbers of differentially expressed genes (DEGs) are depicted. Genes were considered as differentially expressed with p-value ≤ 0.05 (after false discovery rate adjustment) and an absolute log2fold change of ≥0.5. A full list of all genes and their regulation can be found in Supplementary Materials. (C) Principal component analysis (PCA) of the early transcriptome responses (2 h) to TNFα, IFNγ and co-treatment of TNFα plus IFNγ. Triangles and circles show samples belonging to one differentiation batch. The PCA axes are scaled according to the variance covered. (D–F) The time-dependent changes in gene expression in astrocytes in response to (D) TNFα, (E) IFNγ and (F) co-treatment with TNFα plus IFNγ were analyzed by principal component analysis (PCA). The first two PCA dimensions are shown with the axes scaled according to the variance covered. Triangles/circles indicate samples belonging to one differentiation batch. The gray arrows represent the overall trend of gene regulation, they are fitted to the average PCA position of the four samples.

