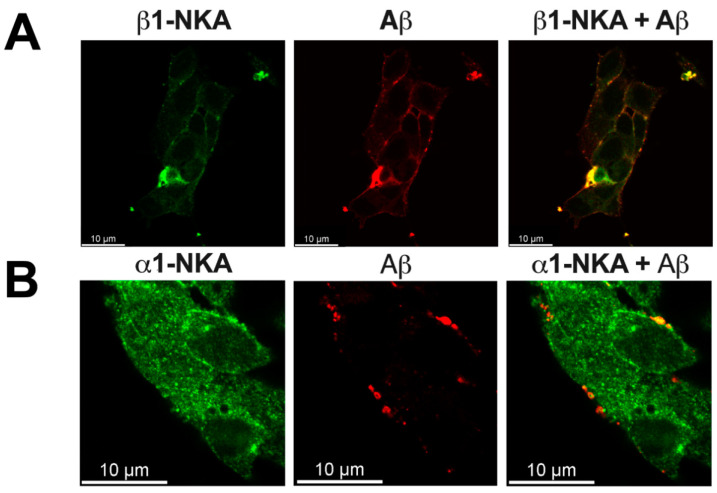
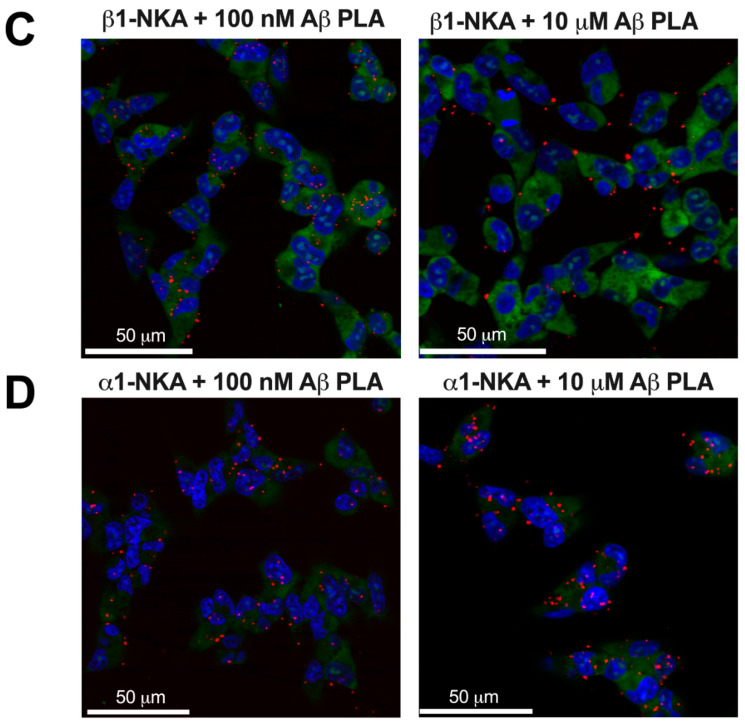
Figure 1.
Aβ42 co-localizes with Na,K-ATPase. (A,B) Co-localization studies with confocal microscopy. Representative immunofluorescence images of neuroblastoma cells SH-SY5Y treated with 40 µM Aβ42 for 2 h. The distribution of (A) β1- and (B) α1-subunits of Na,K-ATPase (green fluorescence), the distribution of Aβ42 (red fluorescence), and the merged (β1/α1-subunit and Aβ42) image. Scale bar—10 µm. (C,D) Co-localization studies with Proximity Ligation Assay (PLA) in SH-SY5Y neuroblastoma cells. The close proximity sites, where the studied molecules are closer than 40 nm to each other, are visualized as red dots using the Duolink Red detection reagent. The confocal merged images of Hoechst fluorescence (blue), RNASelect (green) and Duolink Red (red) fluorescence are presented. (C) Close proximity of Aβ42 and Na,K-ATPase β1-subunit in SH-SY5Y cells treated with 100 nM and 10 µM Aβ42 for 1 h. Scale bar—50 µm. (D) Close proximity of Aβ42 and Na,K-ATPase α1-subunit in SH-SY5Y neuroblastoma cells treated with 100 nM and 10 µM Aβ42 for 1 h. Scale bar—50 µm.


