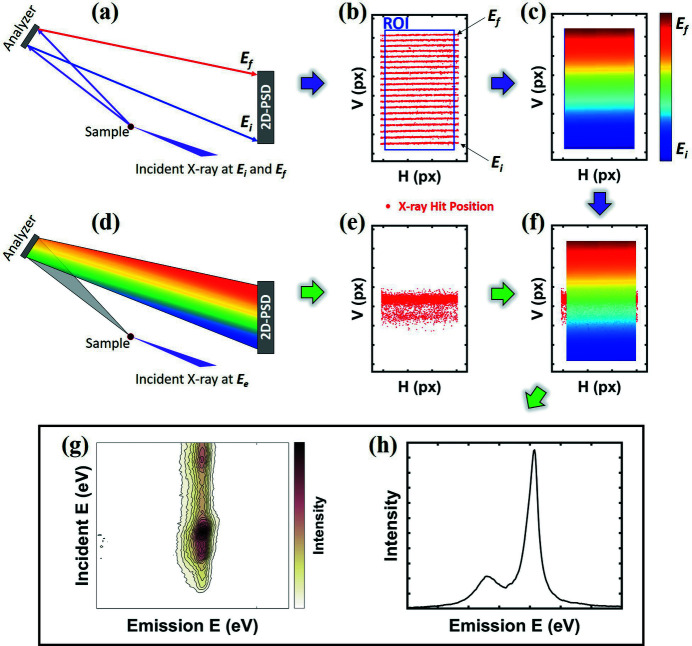
Figure 1.
Workflow for obtaining a spectral form of the Mn Kβ1,3 emission of MnO. (a) Schematic of the optical geometry for obtaining elastically scattered X-rays with two different energies, E i (6445 eV) and E f (6540 eV). (b) Distribution of elastically scattered X-rays on the horizontal H (px) and vertical V (px) pixels of the 2D-PSD for an incident energy range of E i and E f at 5 eV intervals. The blue box indicates the ROI that is described in the text. (c) CEM corresponding to the energy distribution in the ROI of (b). (d) Schematic of the geometry used to obtain emission X-rays at a specific energy E e. (e) Distribution of emitted X-rays on the 2D-PSD. (f) Applying CEM to the distribution of (e). (g) Mn Kβ1,3 RXES and (h) Mn Kβ1,3 XES of MnO.

