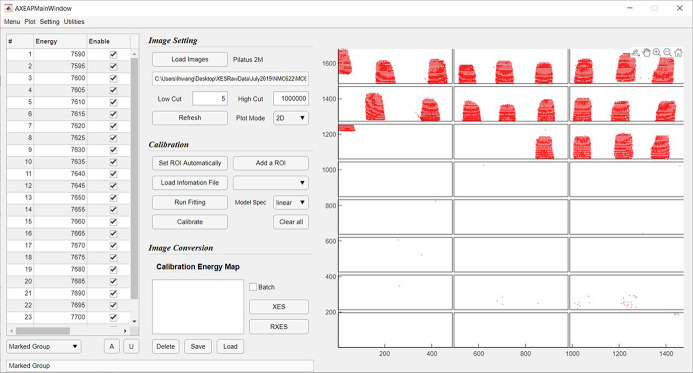
Figure 2.
A screenshot of the main window of AXEAP. The graphic part on the right-hand side shows the distribution of the X-ray hit positions as red dots and is divided into 24 areas due to the specification of the detector used for measurement. The signal shown in the graphic part represents the 25 merged images as X-ray hit distributions, which were taken 25 times, each using different incident energies for Co Kβ1,3 emission line measurements. In this experiment, 22 InP (444) analyzers were used.

