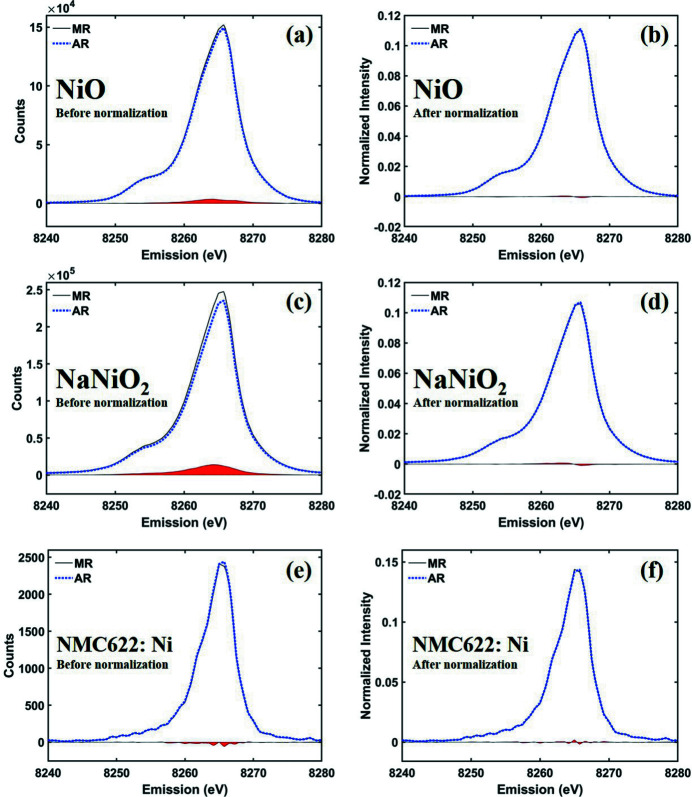
Figure 4.
Ni Kβ1,3 spectra of nickel oxides converted by MR and AR. The solid black and the dotted blue lines represent MR and AR, respectively, for (a, b) NiO before and after normalization, (c, d) NaNiO2 before and after normalization, and (e, f) NMC622 at Ni Kβ1,3 emission spectra before and after normalization, respectively. The red colored areas indicate the differences between the MR and AR spectra.

