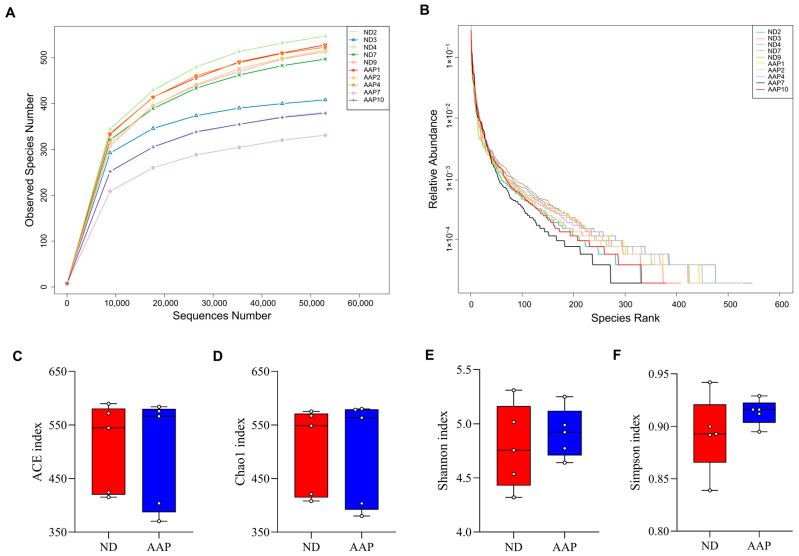
Figure 1.
The effects of Auricularia auricula polysaccharides on α diversity of intestinal flora in mice. (A) Dilution curve; (B) Rank Abundance curve; (C) Group difference box diagram of the ACE index; (D) Chao 1 index; (E) Shannon index; (F) Simpson index. ND = normal diets; AAP = Auricularia auricula polysaccharides. Data presented as mean ± SD, n = 5.

